Digital Data of Control System
Digital Data Definition
Digital data in control systems consists of discrete or sampled data that represents continuous signals in a digital format.
Sampling Process
Sampling is the conversion of analog signals to digital signals using a sampler, which switches ON and OFF.
The sampling process converts analog signals into digital signals using a switch, called a sampler, that turns ON and OFF. For an ideal sampler, the output pulse width is very small (almost zero). In discrete systems, Z transformations play a crucial role, similar to Fourier transform in continuous systems. Let’s explore Z transformations and their uses in detail.
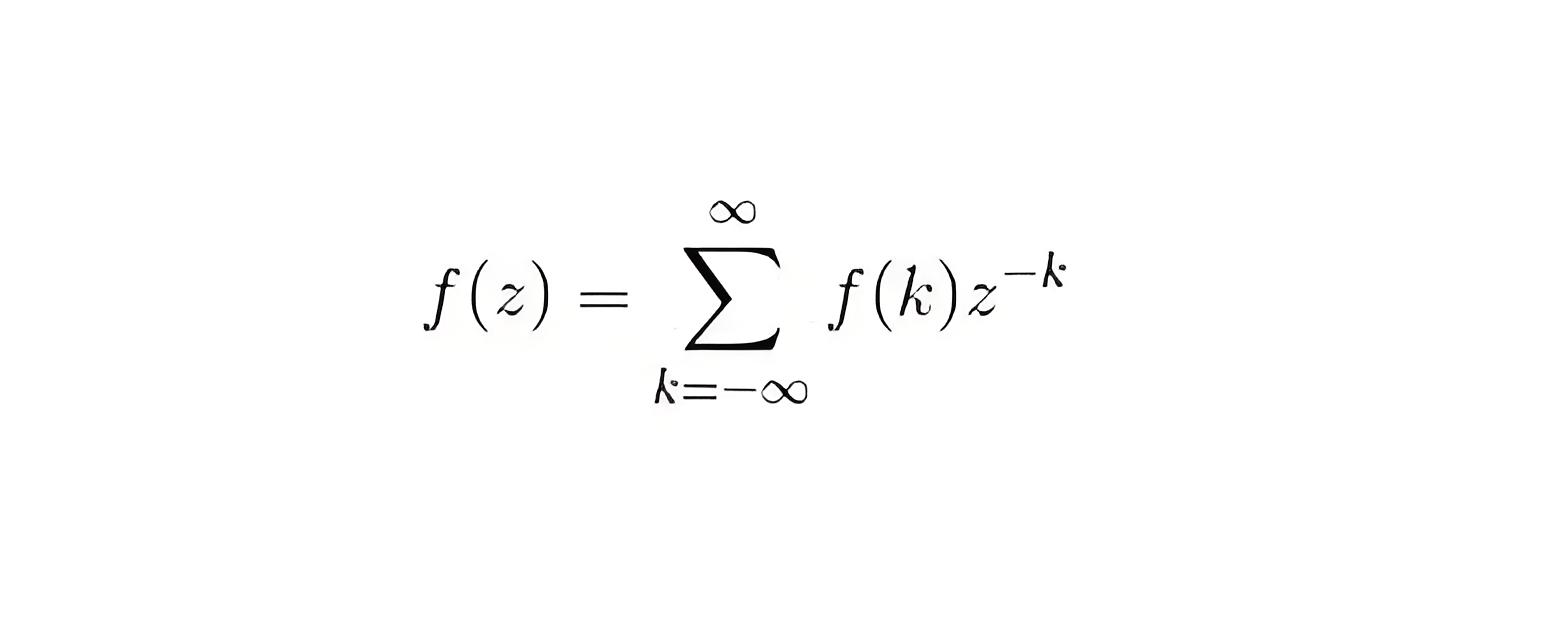
We define z transform as
Where, F(k) is a discrete data
Z is a complex number
F (z) is Fourier transform of f (k).
Important Properties of z transformation are written below
Linearity
Let us consider summation of two discrete functions f (k) and g (k) such that
such that p and q are constants, now on taking the Laplace transform we have by property of linearity:
Change of Scale: let us consider a function f(k), on taking the z transform we have
then we have by change of scale property
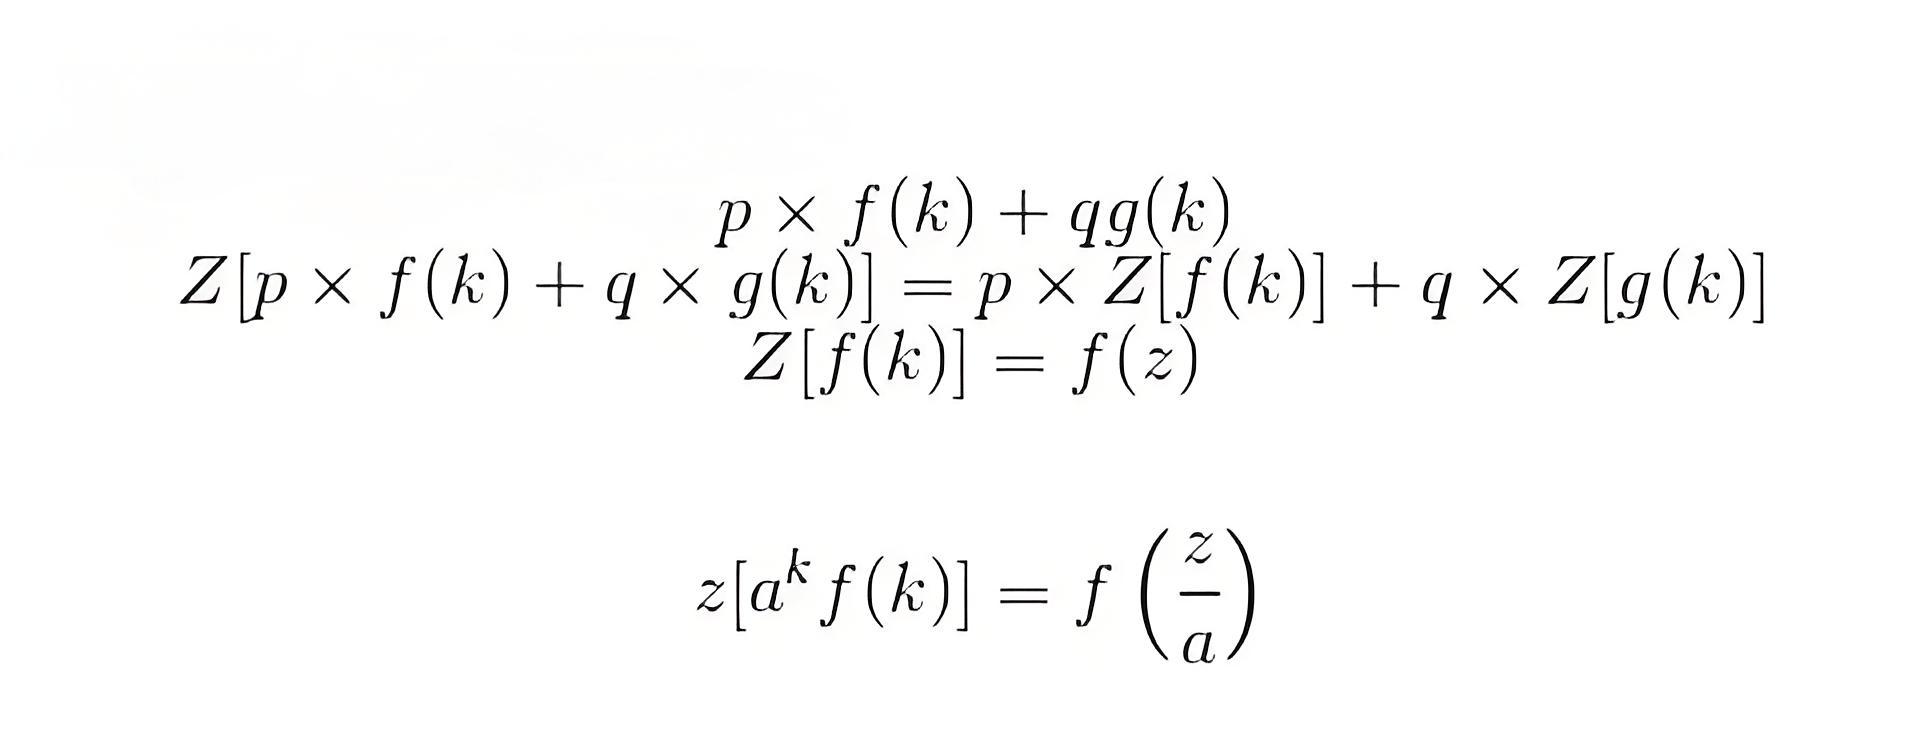
Shifting Property: As per this property
Now let us discuss some important z transforms and I will suggest readers to learn these transforms:
Laplace transformation of this function is 1/s 2 and the corresponding f(k) = kT. Now the z transformation of this function is
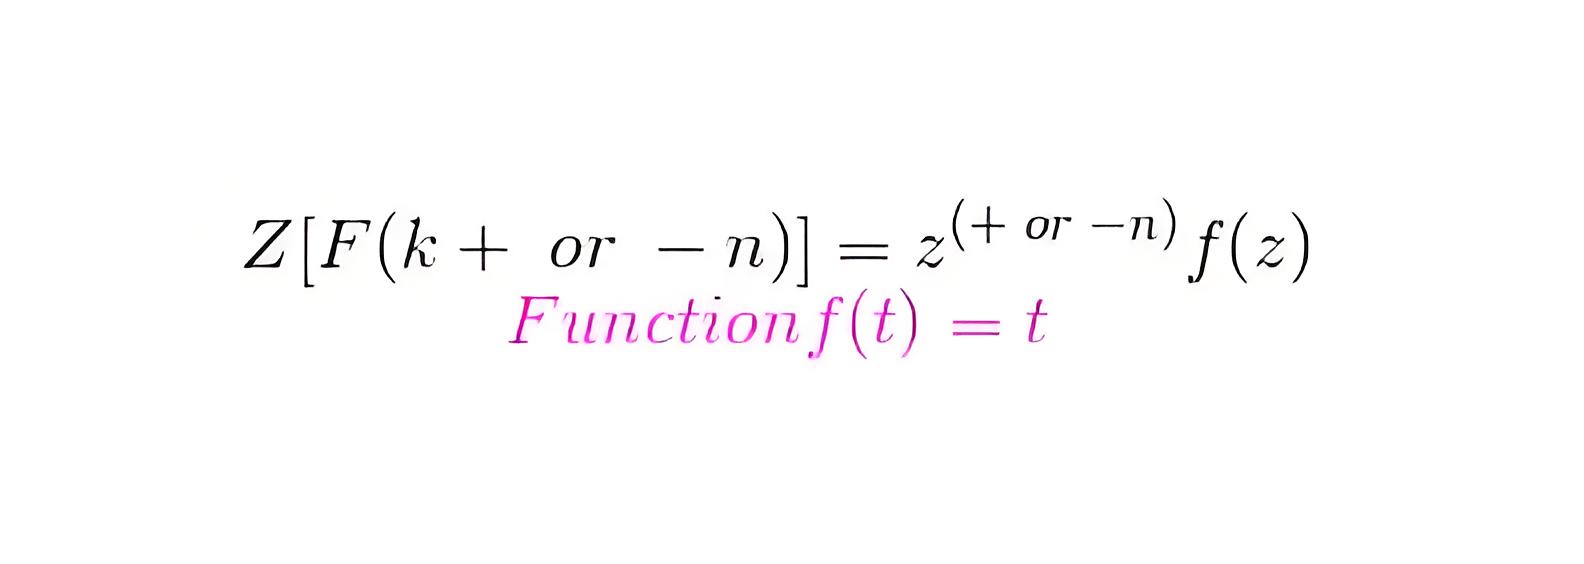
Laplace transformation of this function is 2/s3 and the corresponding f(k) = kT. Now the z transformation of this function is
Laplace transformation of this function is 1/(s + a) and the corresponding f(k) = e (-akT)

Now the z transformation of this function is
Laplace transformation of this function is 1/(s + a) 2 and the corresponding f(k) = Te-akT. Now the z transformation of this function is
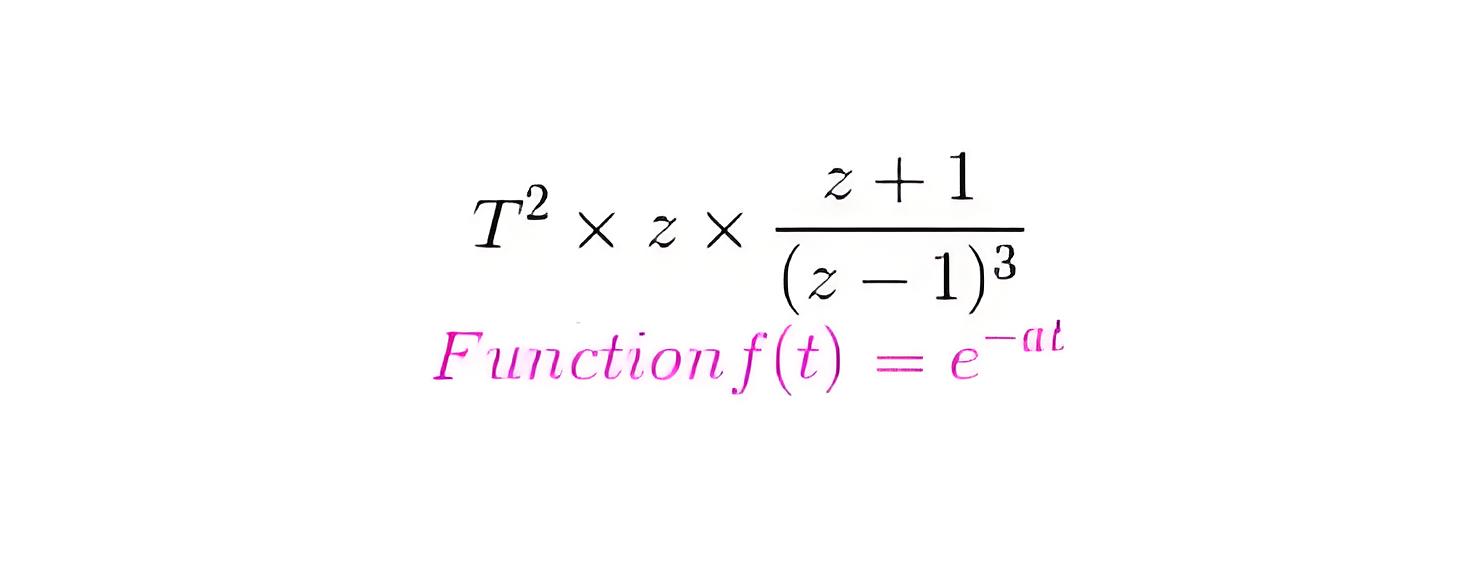
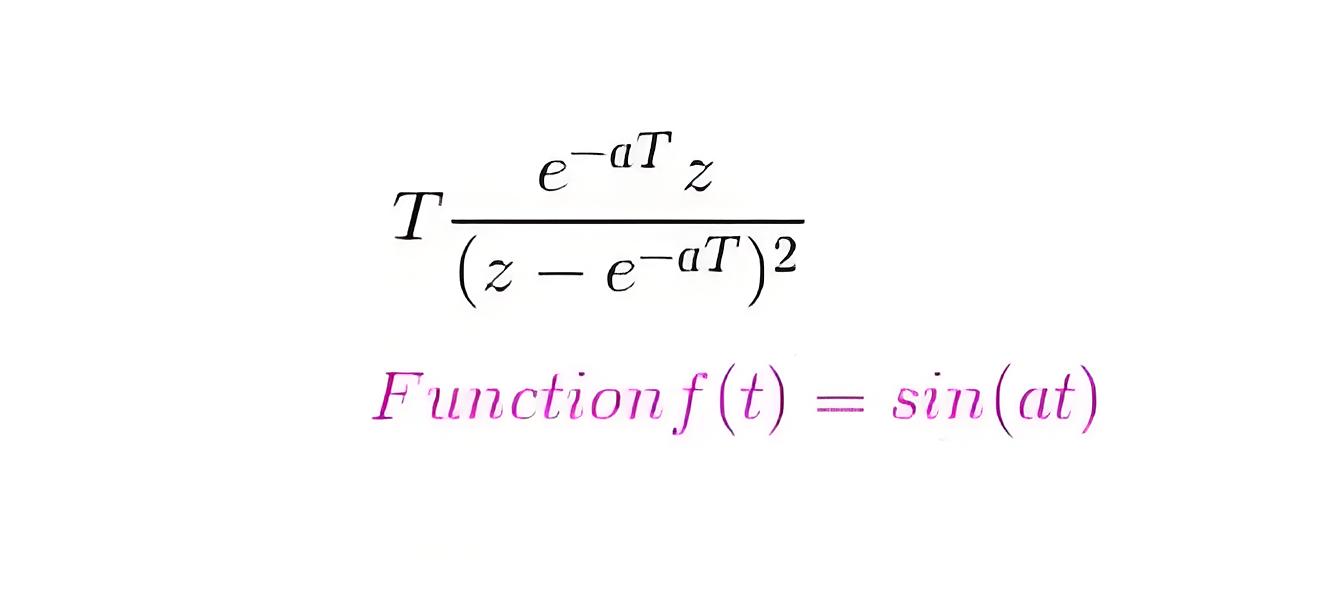
Laplace transformation of this function is a/(s 2 + a2) and the corresponding f(k) = sin(akT). Now the z transformation of this function is
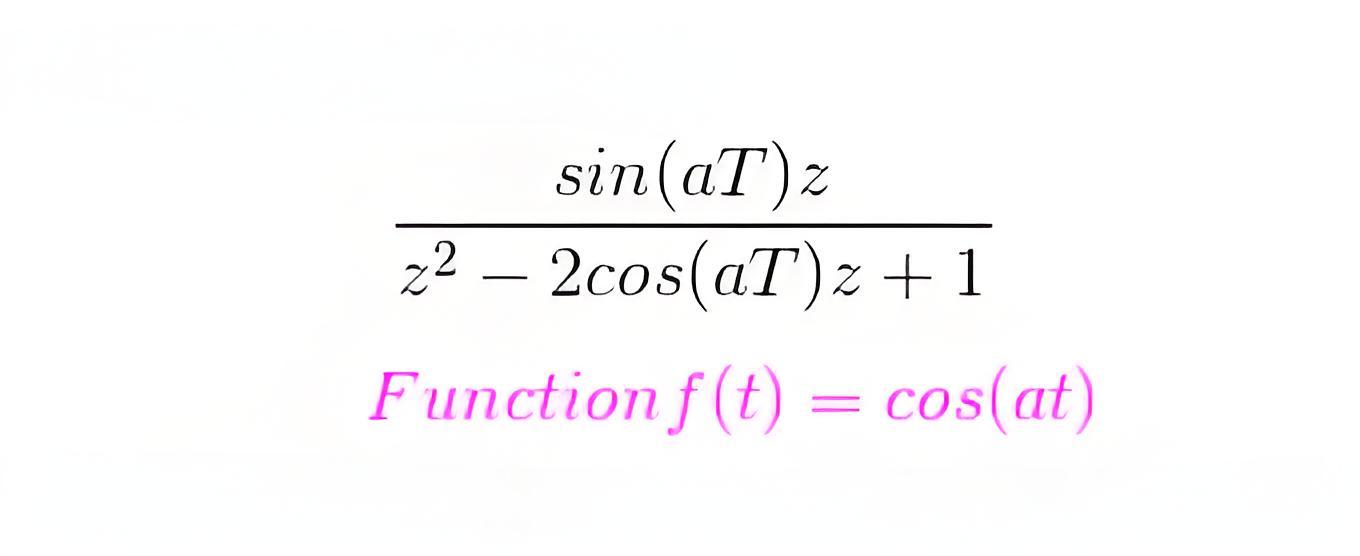
Laplace transformation of this function is s/(s 2 + a2) and the corresponding f(k) = cos(akT). Now the z transformation of this function is
Now sometime there is a need to sample data again, which means converting discrete data into continuous form. We can convert digital data of control system into continuous form by hold circuits which are discussed below:

Hold Circuits: These are the circuits which converts discrete data into continuous data or original data. Now there are two types of Hold circuits and they are explained in detail:
Zero Order Hold Circuit
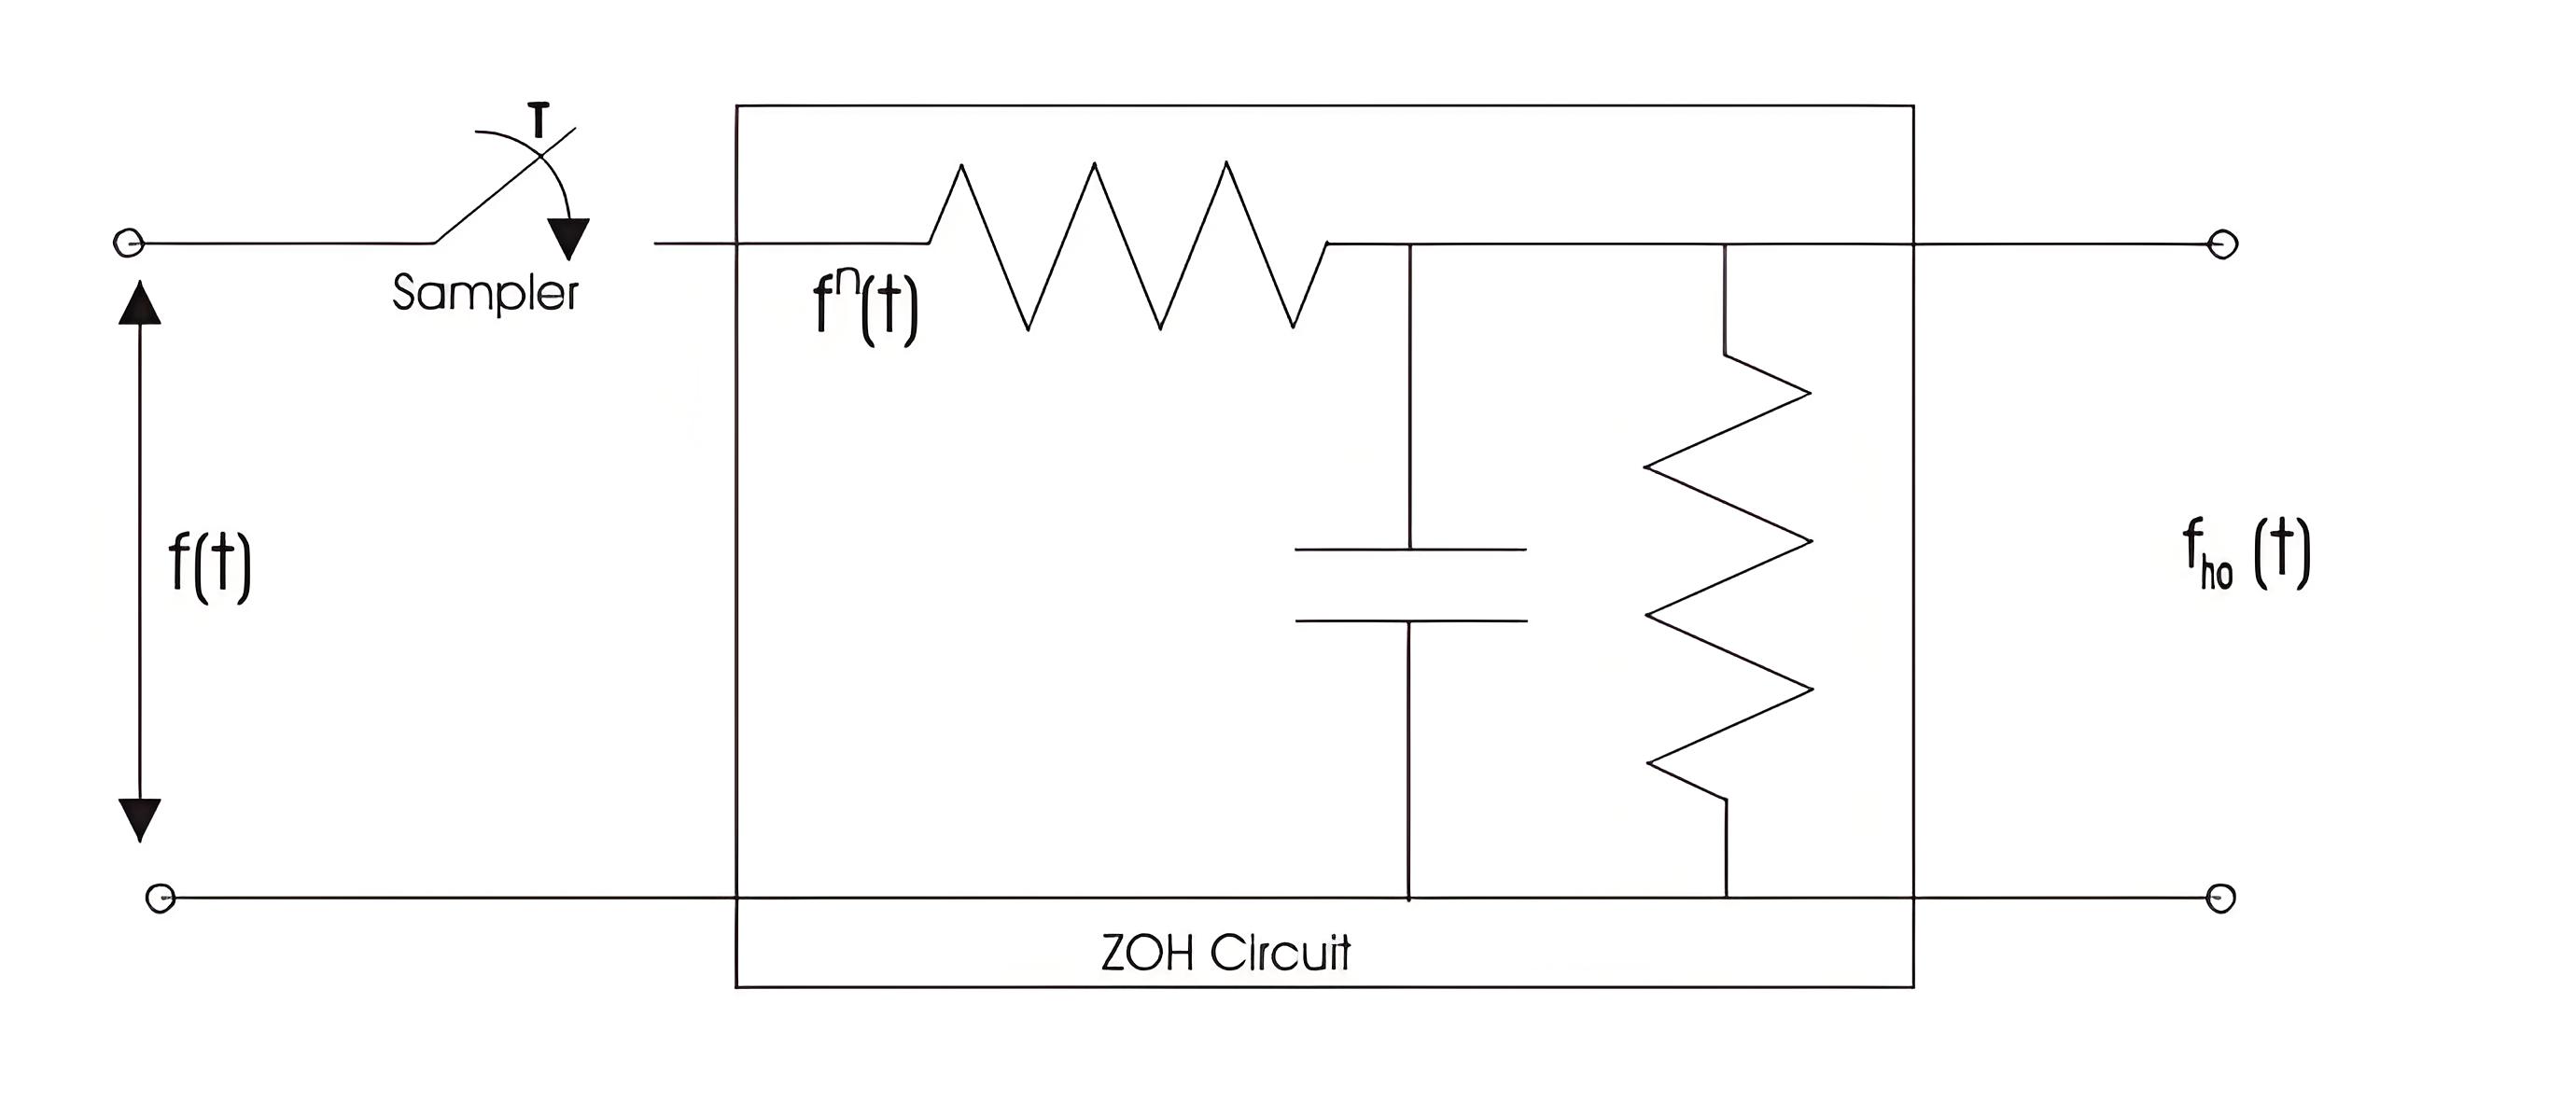
The block diagram representation of the zero order hold circuit is given below:
Figure related to zero order hold.
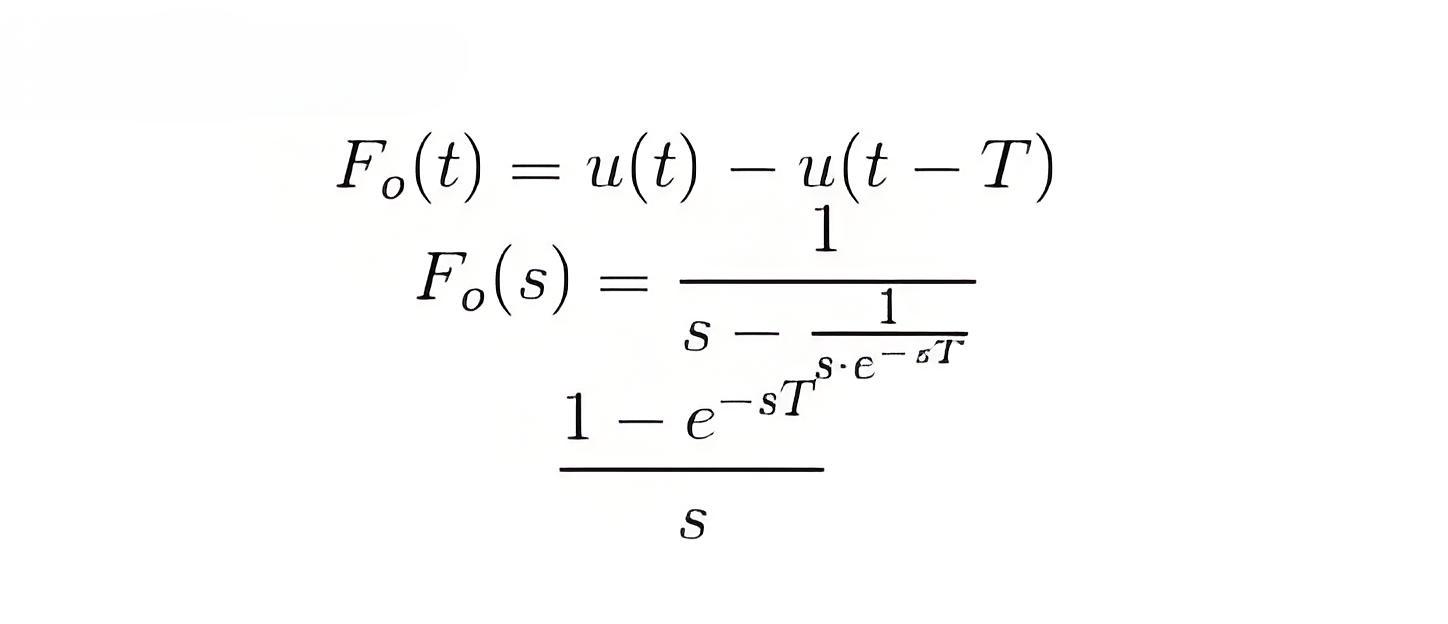
In the block diagram we have given an input f(t) to the circuit, when we allow input signal to pass through this circuit it reconverts the input signal into continuous one. The output of the zero order hold circuit is shown below.Now we are interested in finding out the transfer function of the zero order hold circuit. On writing the output equation we have
on taking the Laplace transform of the above equation we have
From the above equation we can calculate transfer function as
On substituting s=jω we can draw the bode plot for the zero order hold circuit. The electrical representation of the zero order hold circuit is shown below, which consists of a sampler connected in series with a resistor and this combination is connected with a parallel combination of resistor and capacitor.
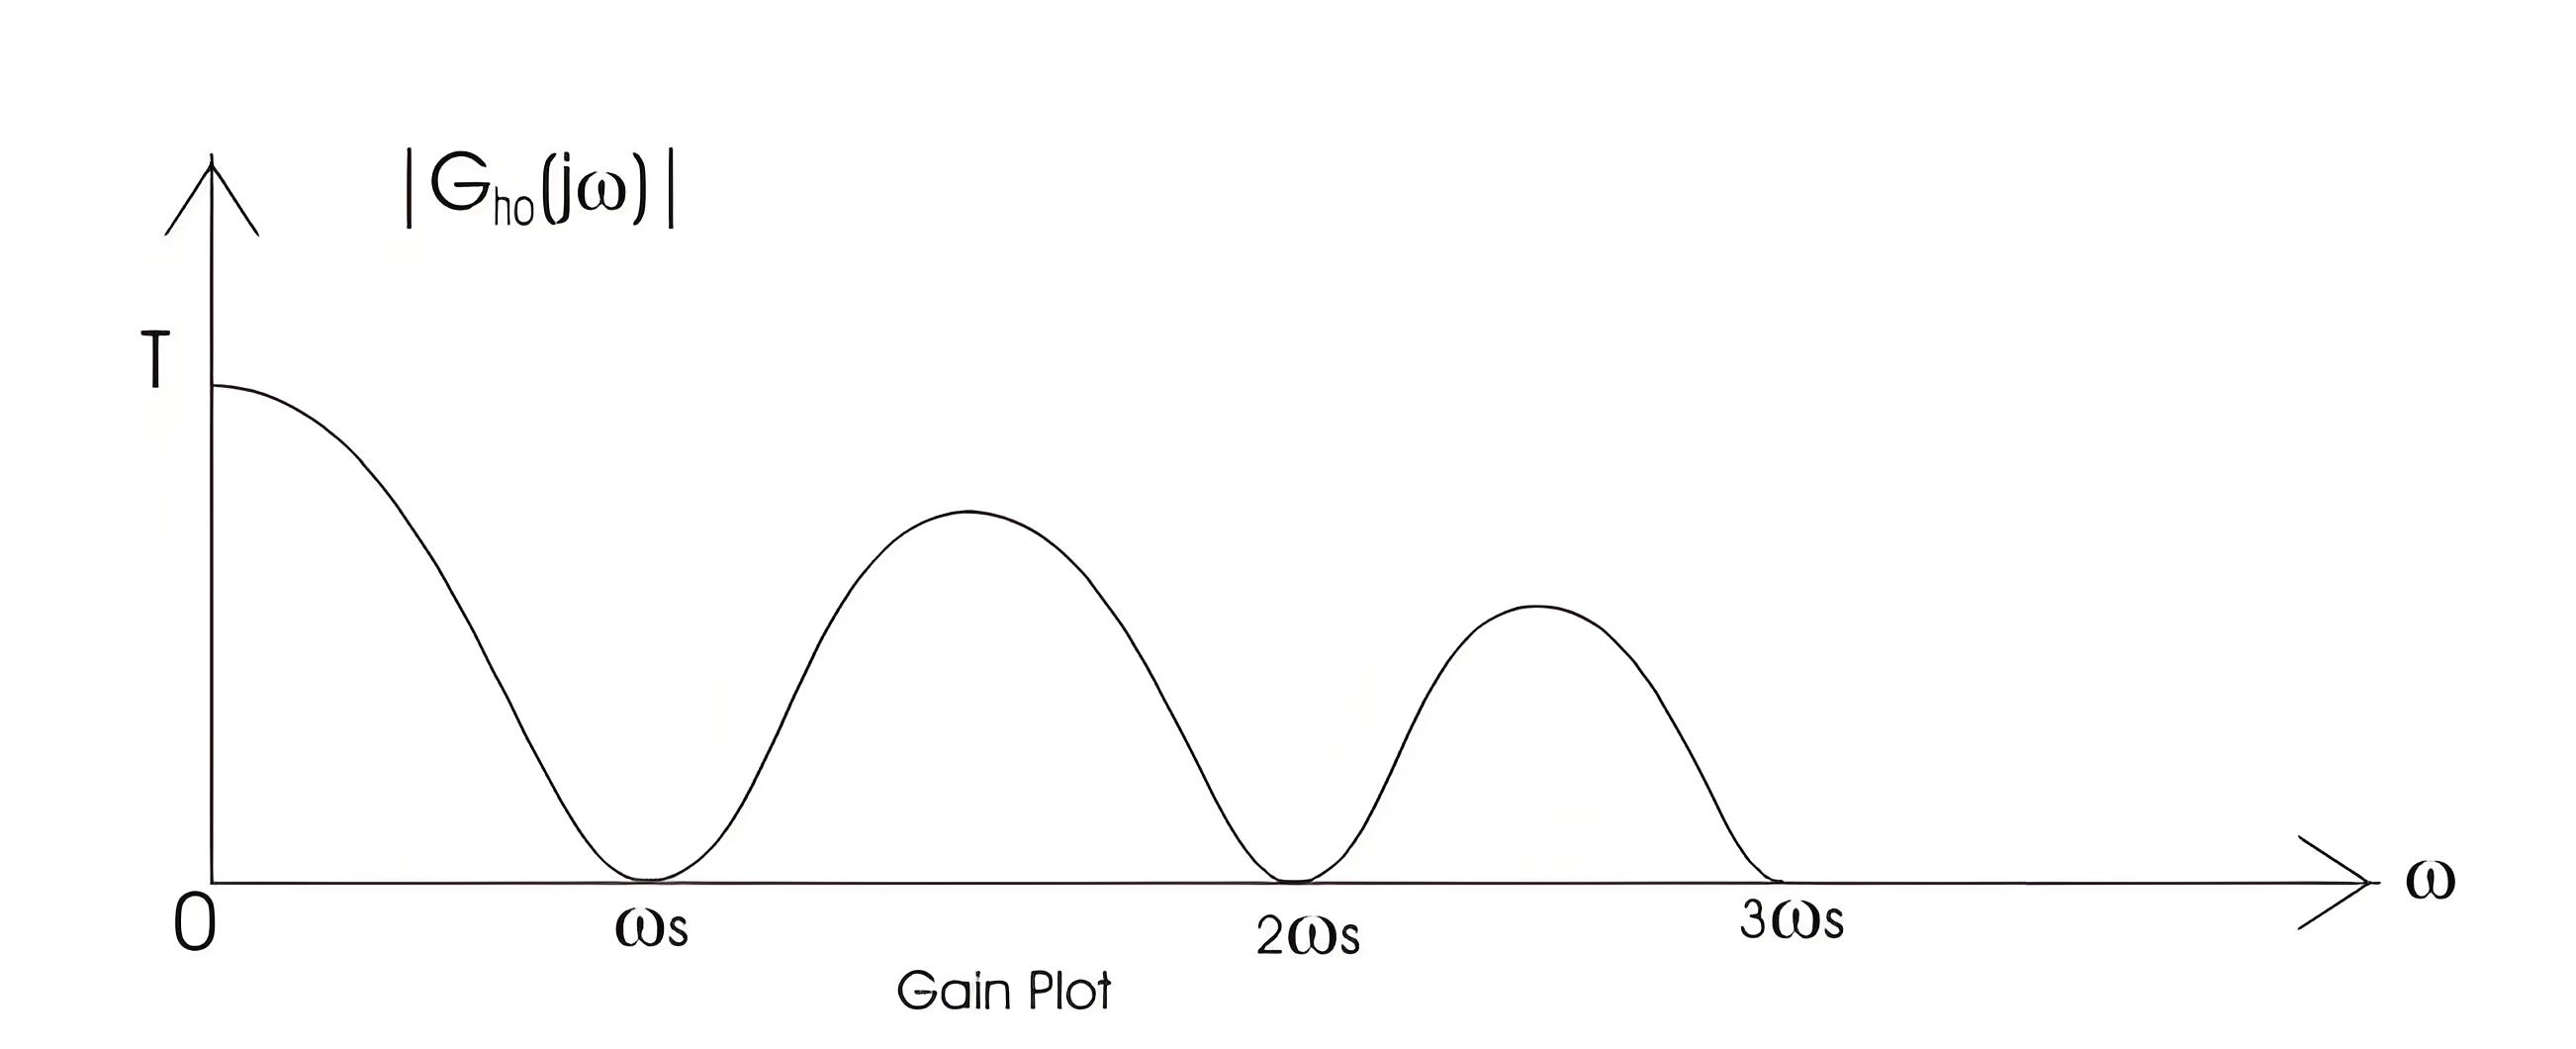
GAIN PLOT – frequency response curve of ZOH
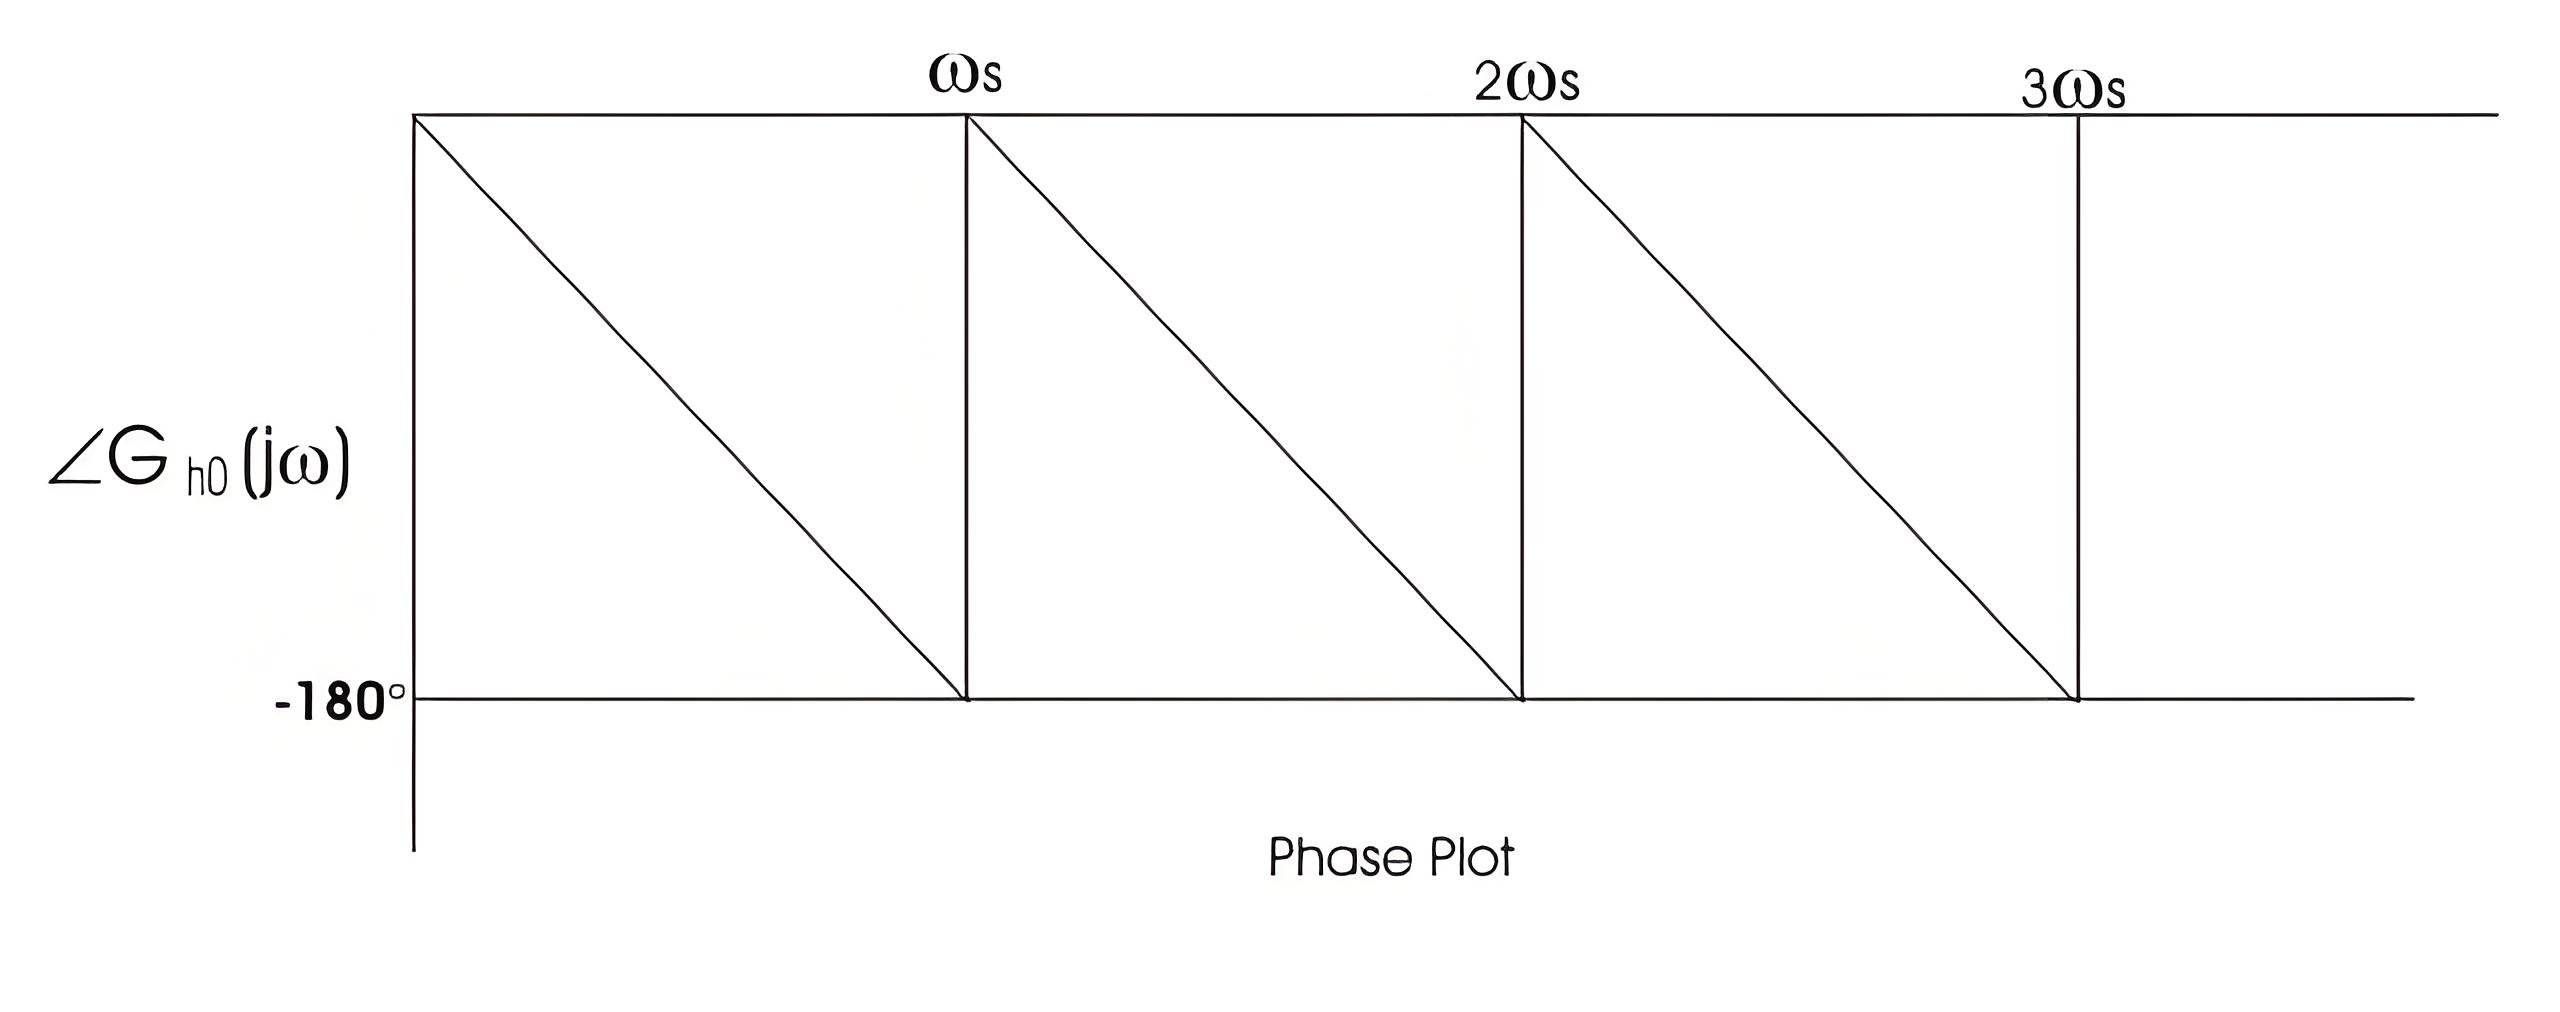
PHASE PLOT – frequency response curve of ZOH
First Order Hold Circuit
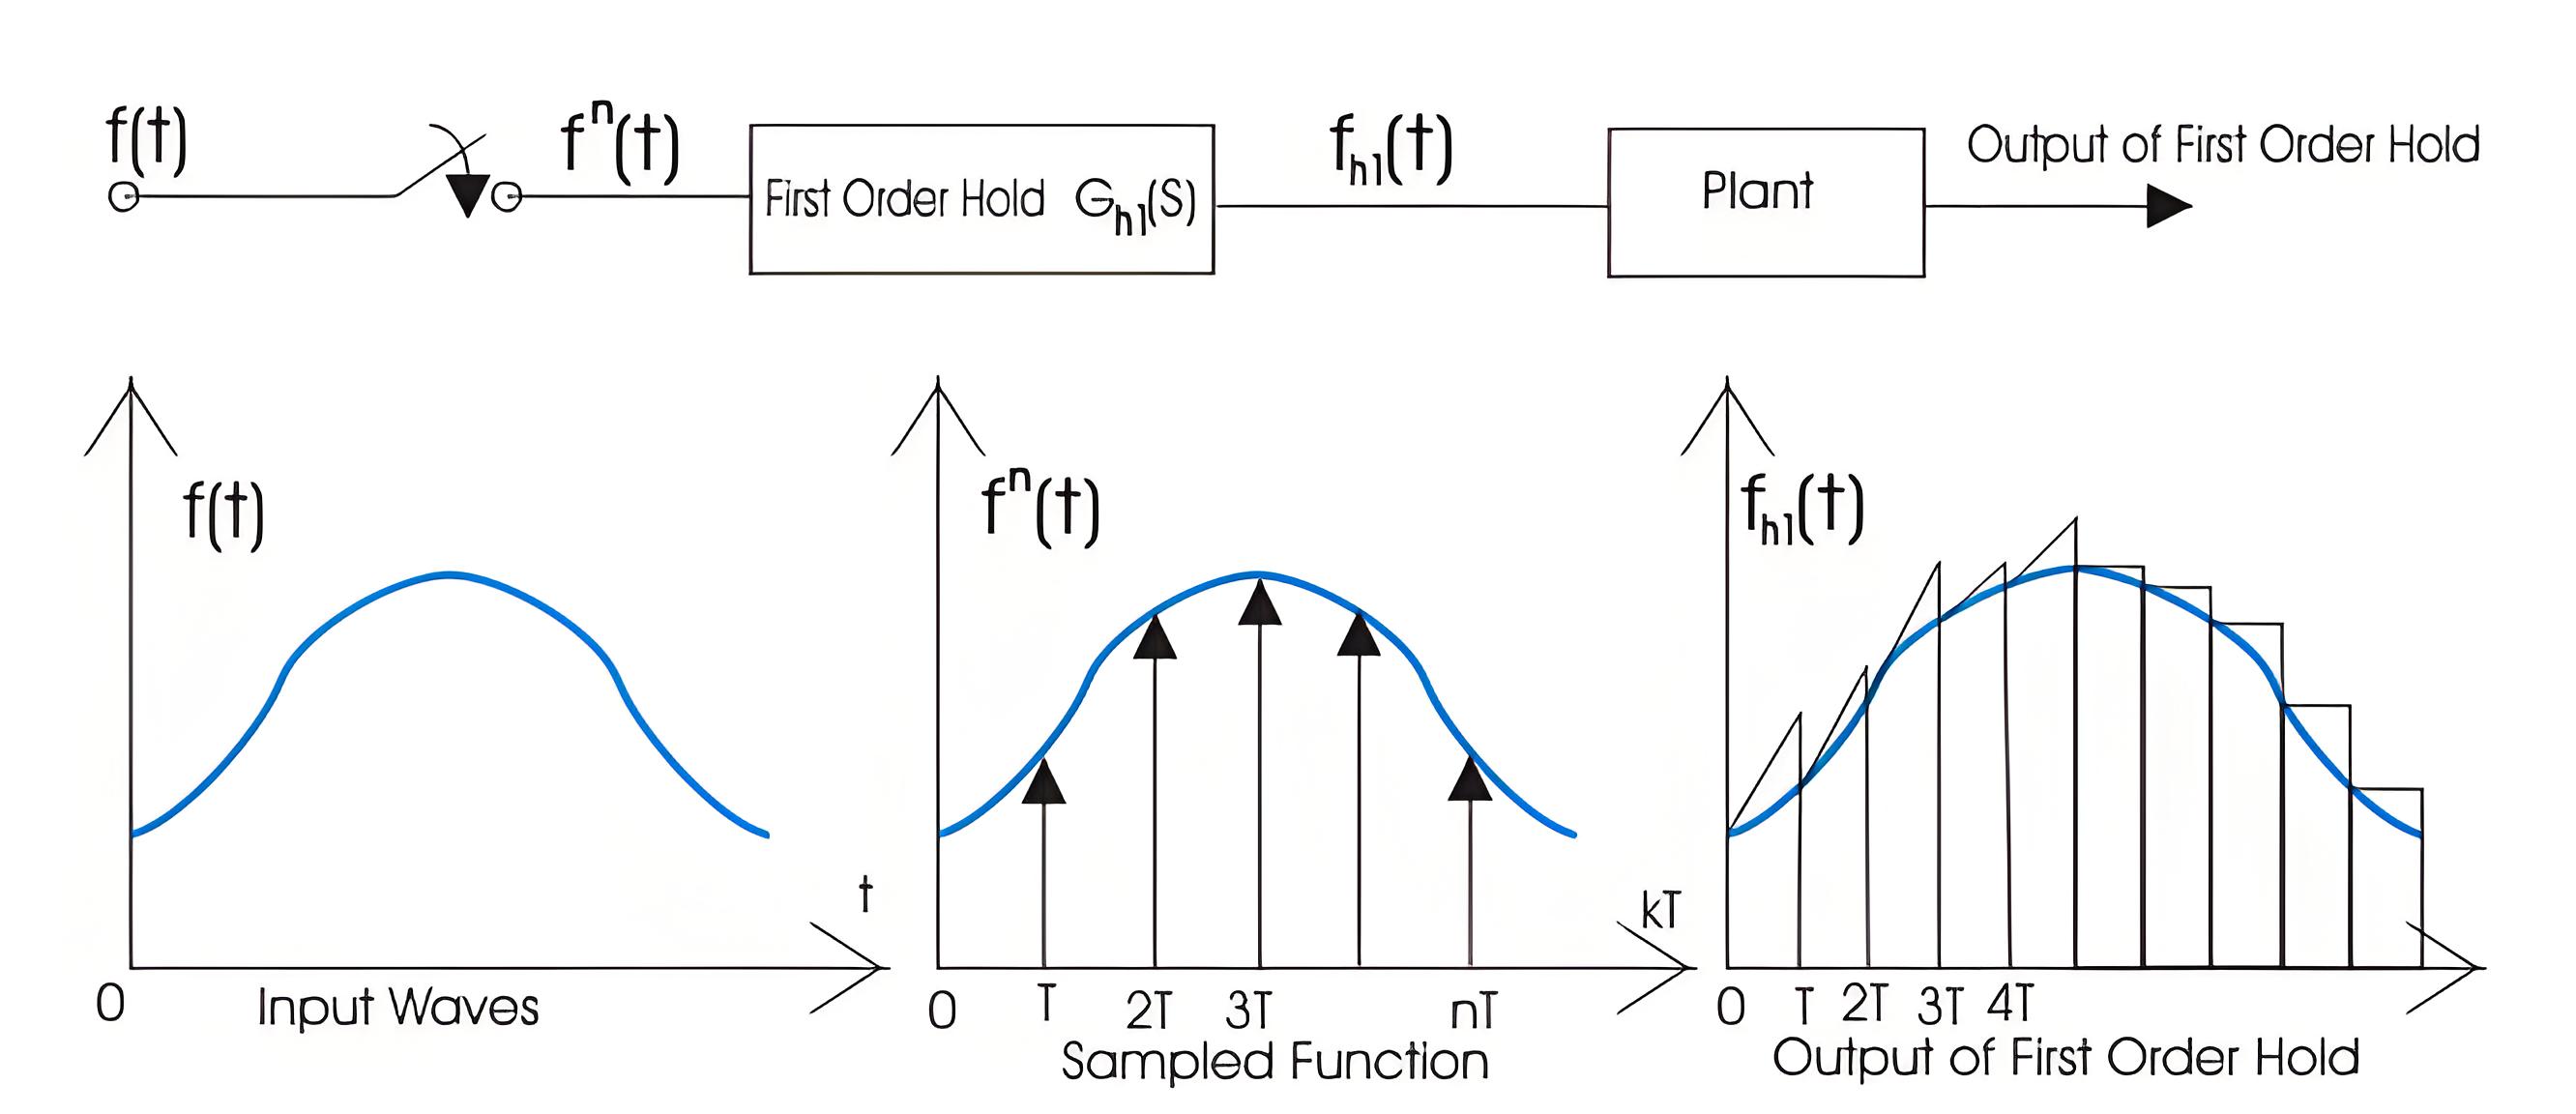
The block diagram representation of the first order hold circuit is given below:
First Order Hold Circuit
In the block diagram we have given an input f(t) to the circuit, when we allow input signal to pass through this circuit it reconverts the input signal into continuous one. The output of the first order hold circuit is shown below: Now we are interested in finding out the transfer function of the first order hold circuit. On writing the output equation we have
On taking the Laplace transform of the above equation we have
From the above equation we can calculate transfer function as (1-e -sT)/s. on substituting s=jω we can draw the bode plot for the zero order hold circuit.
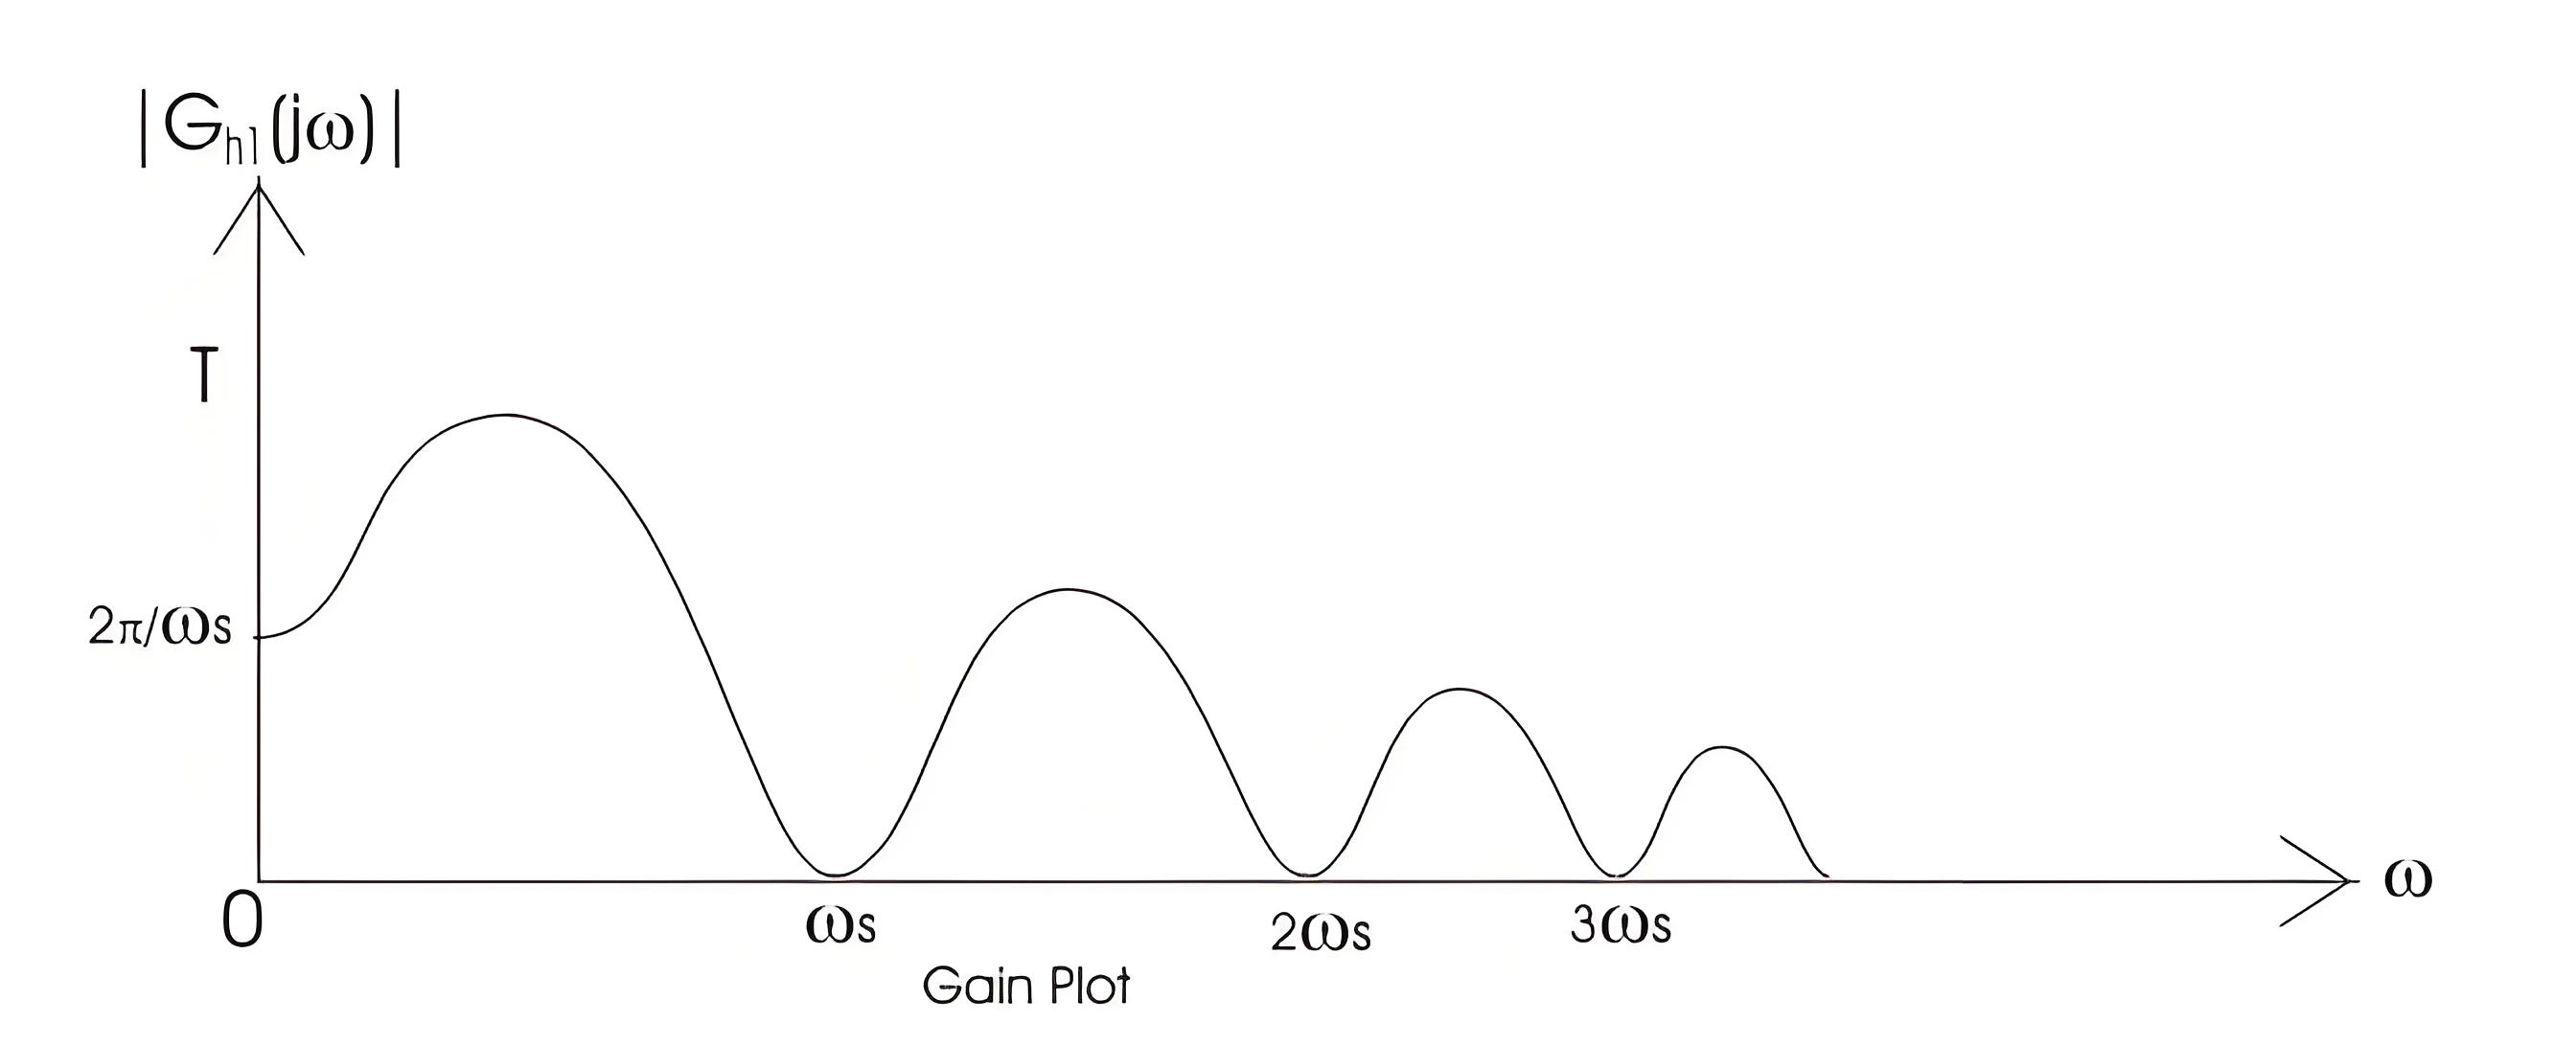
The bode plot for the first order hold circuit is shown below which consists of a magnitude plot and a phase angle plot.The magnitude plot starts with magnitude value 2π/ωs.
The Electricity Encyclopedia is dedicated to accelerating the dissemination and application of electricity knowledge and adding impetus to the development and innovation of the electricity industry.

