What is Power Flow Analysis ?
What is Power Flow Analysis ?
Load Flow Analysis Definition
Load flow analysis is the computational process used to determine the steady-state operating conditions of a power system network.
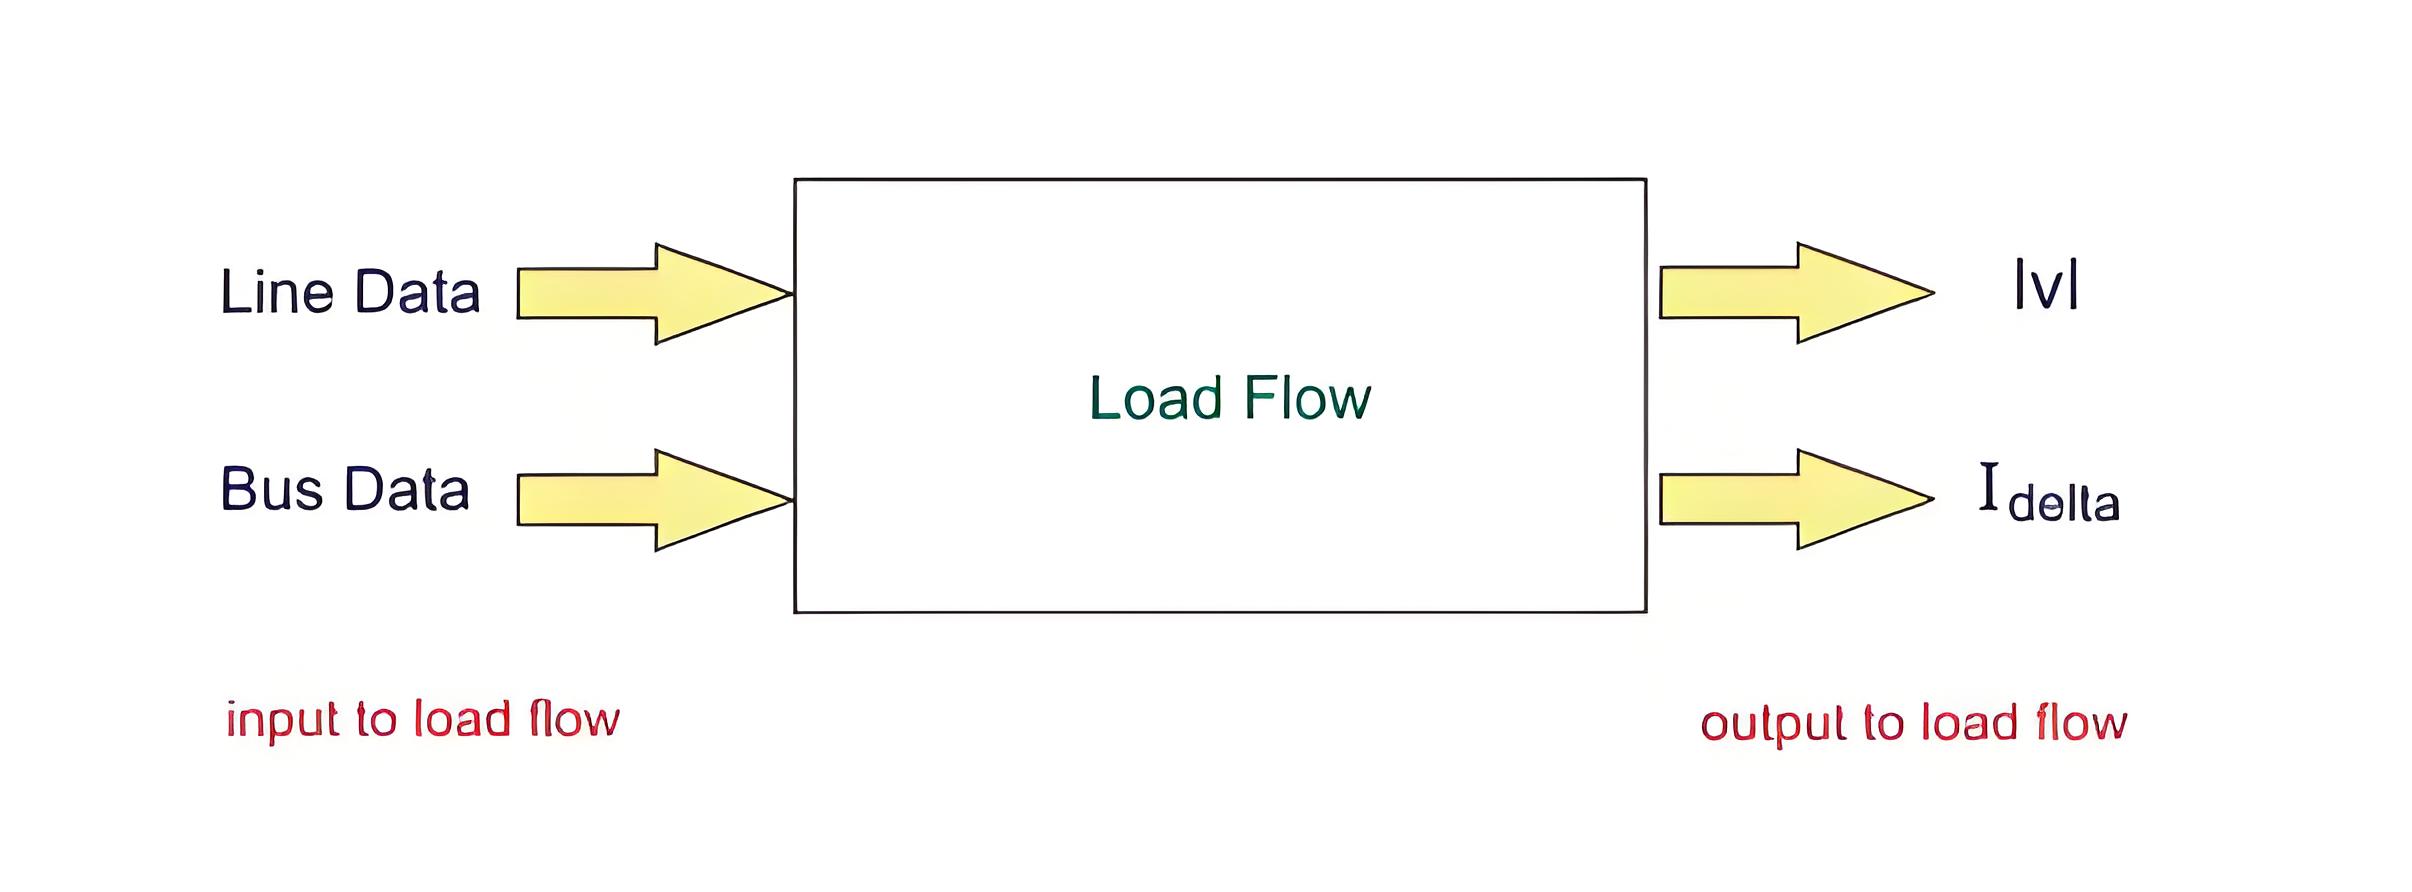
Purpose of Load Flow Study
It determines the operating state of the power system under a given load condition.
Steps in Load Flow Analysis
The study of load flow involves the following three steps:
Modeling of power system components and network.
Development of load flow equations.
Solving the load flow equations using numerical techniques.
Modeling Power System Components
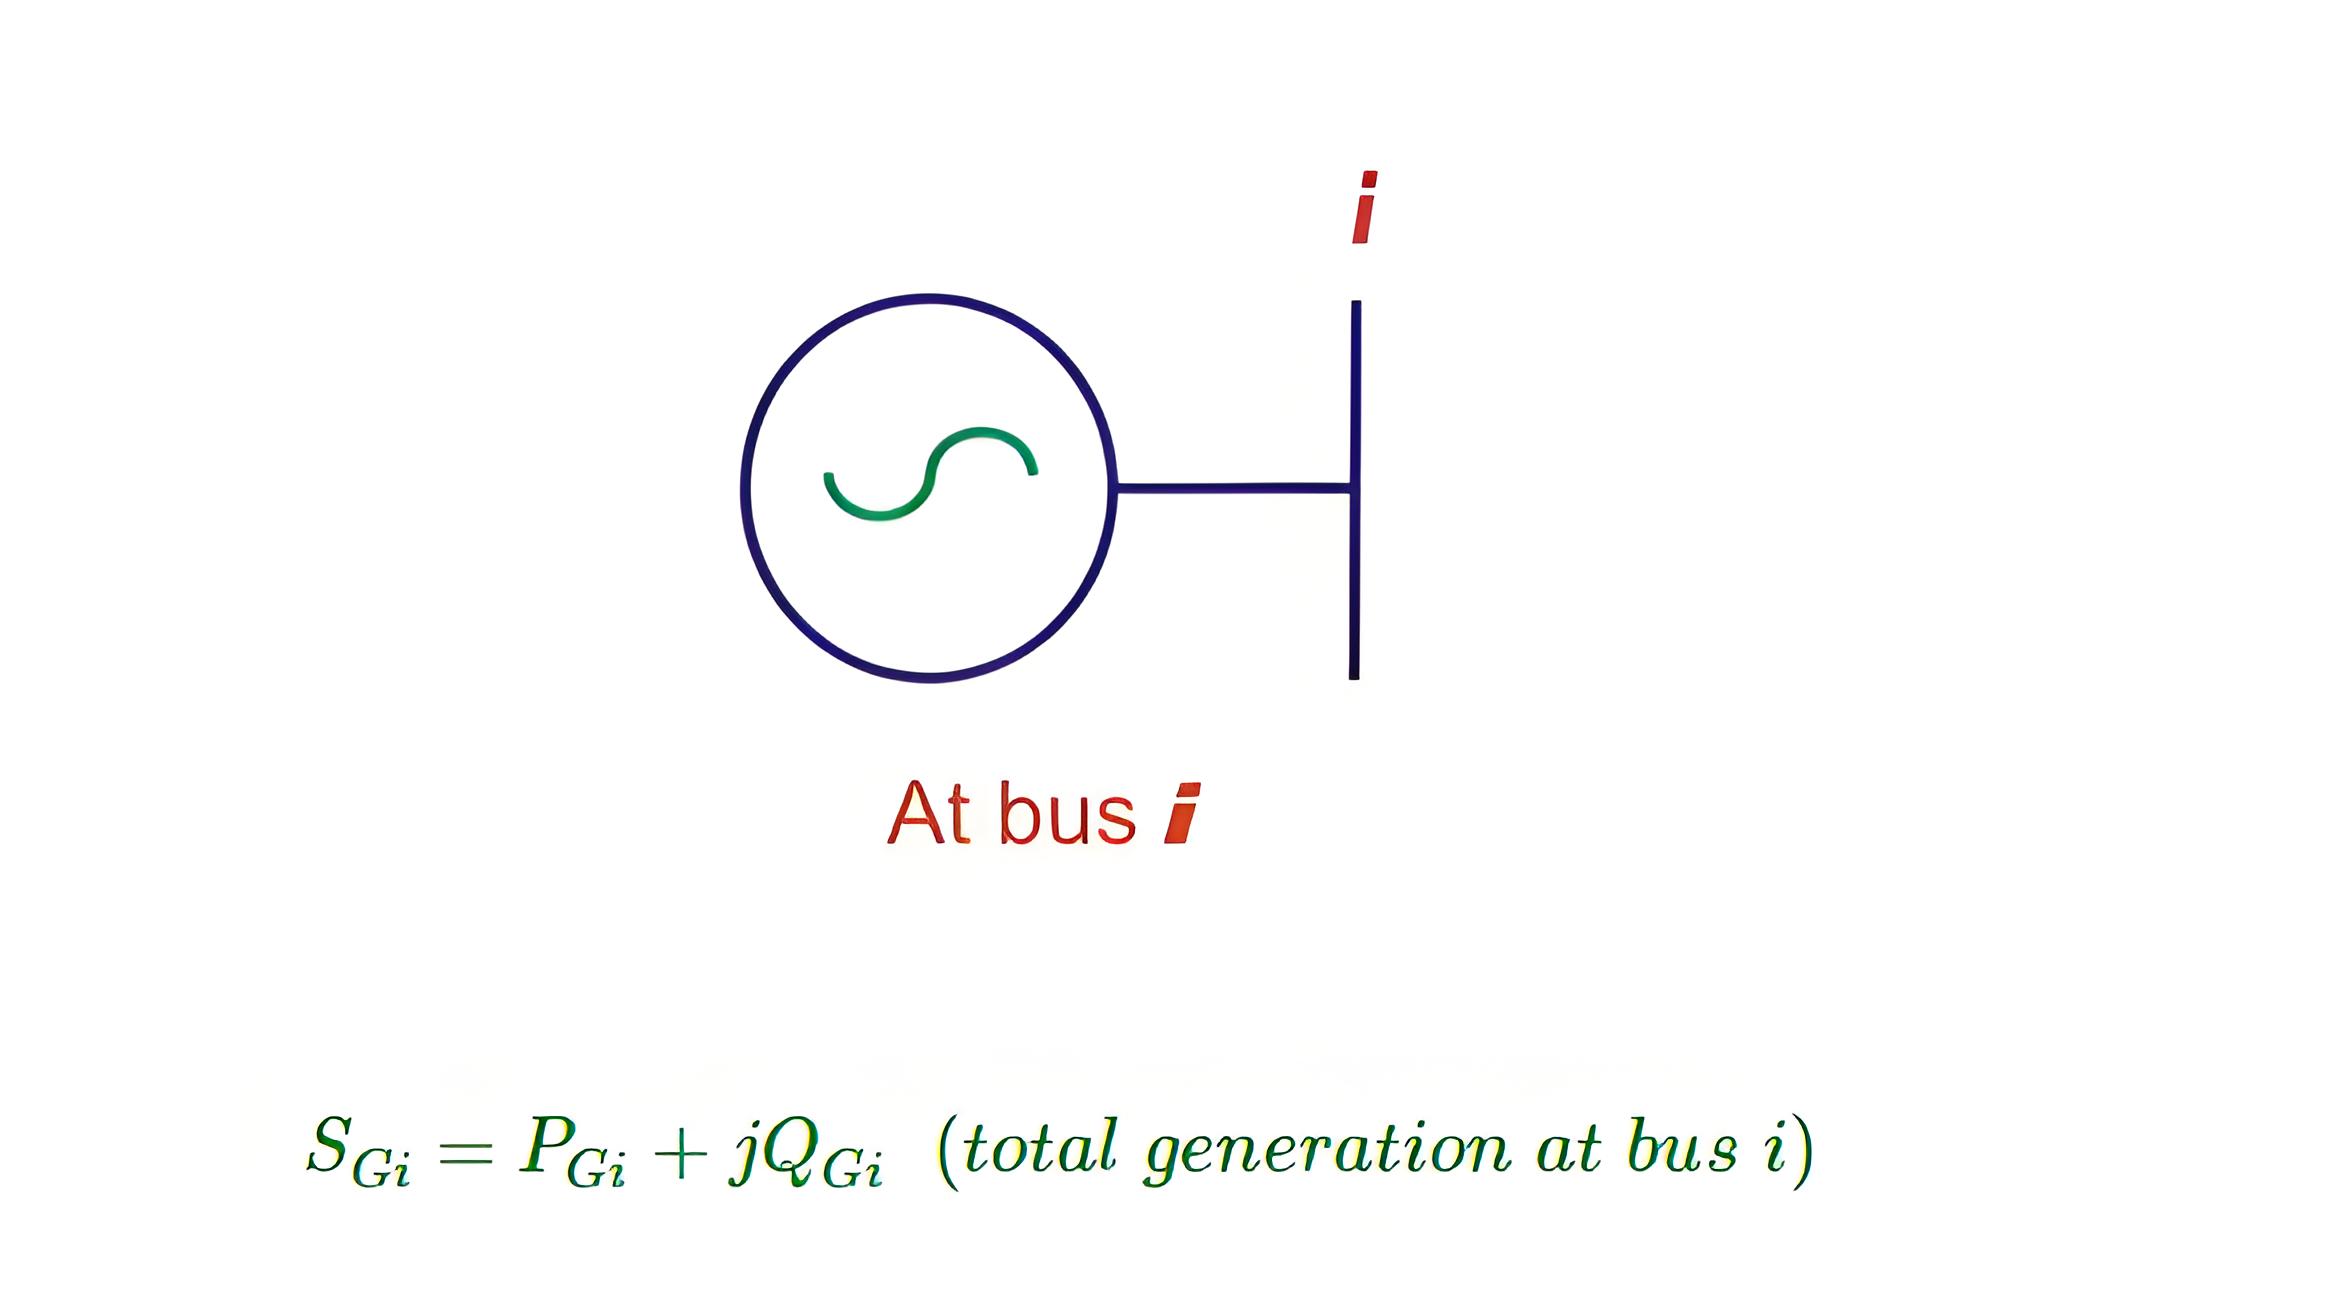
Generator
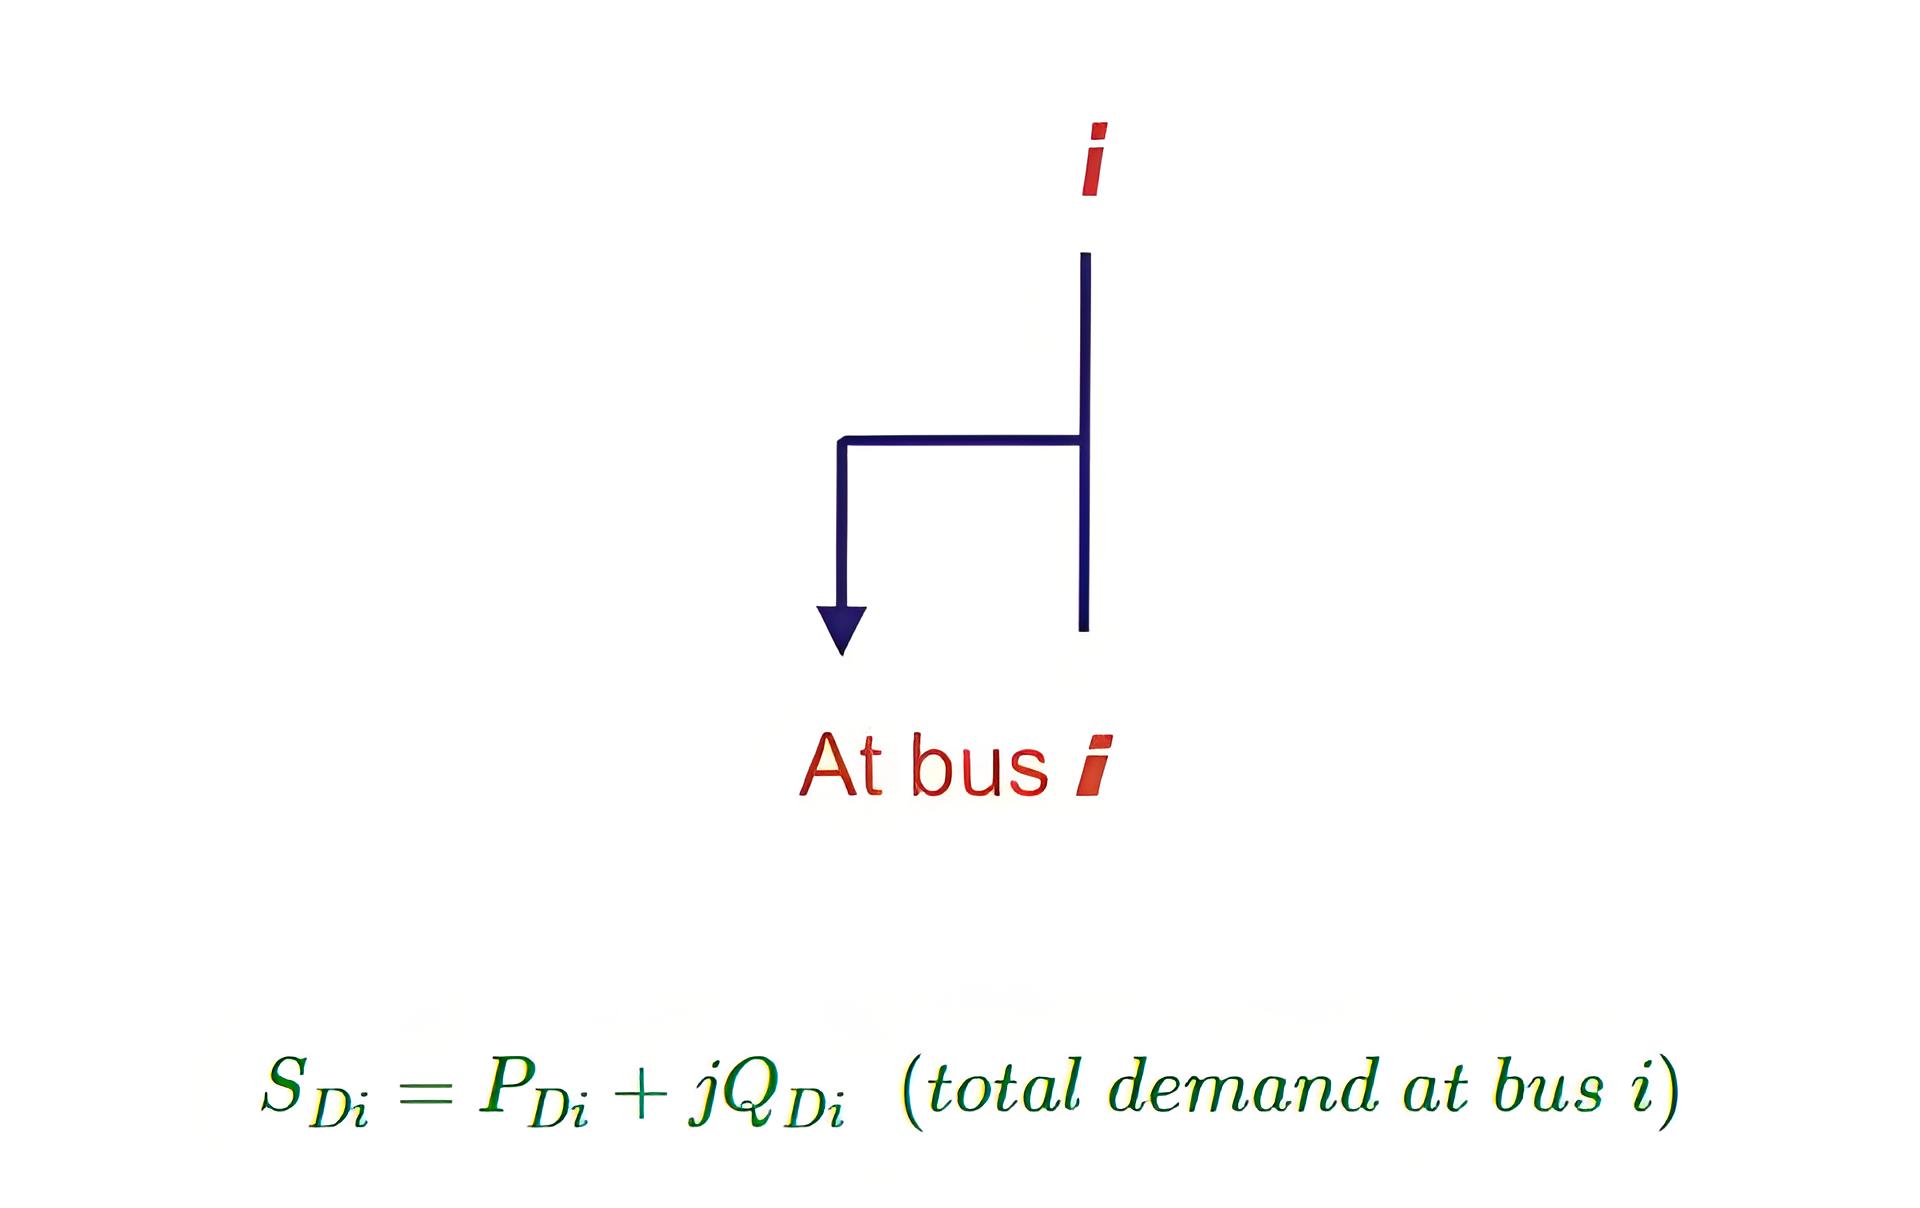
Load
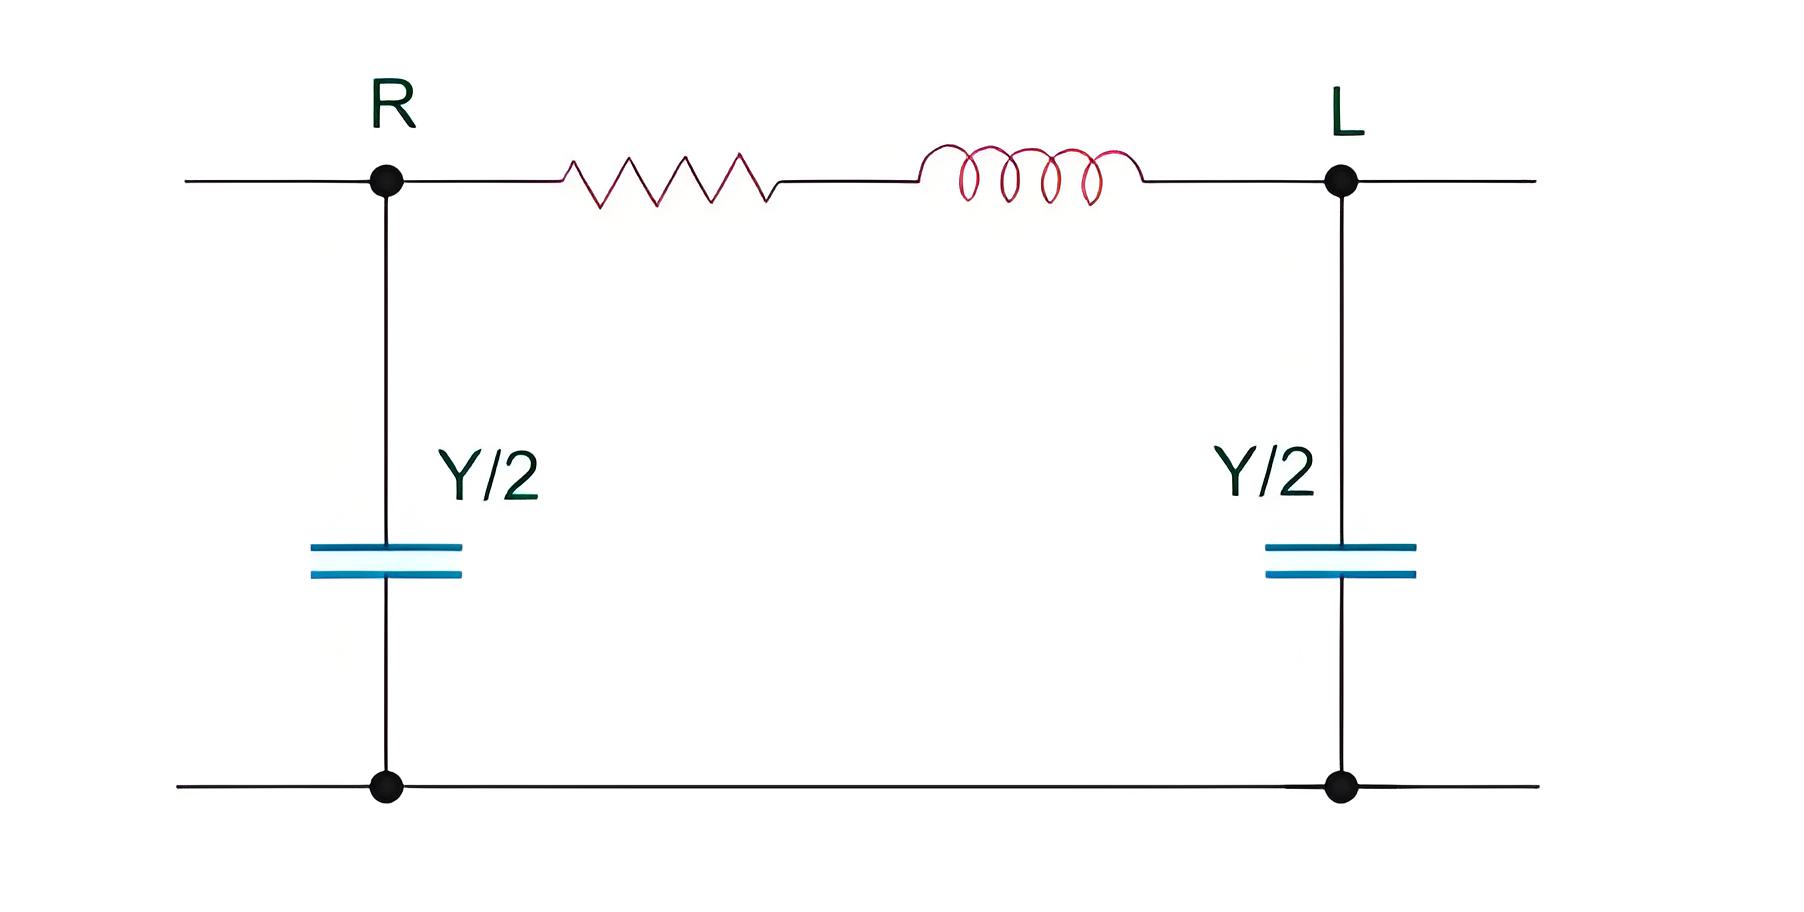
Transmission Line
A Transmission line is represented as a nominal π model.
Where, R + jX is the line impedance and Y/2 is called the half line charging admittance.
Off Nominal Tap Changing Transformer
For a nominal transformer the relation
But for an off nominal transformer
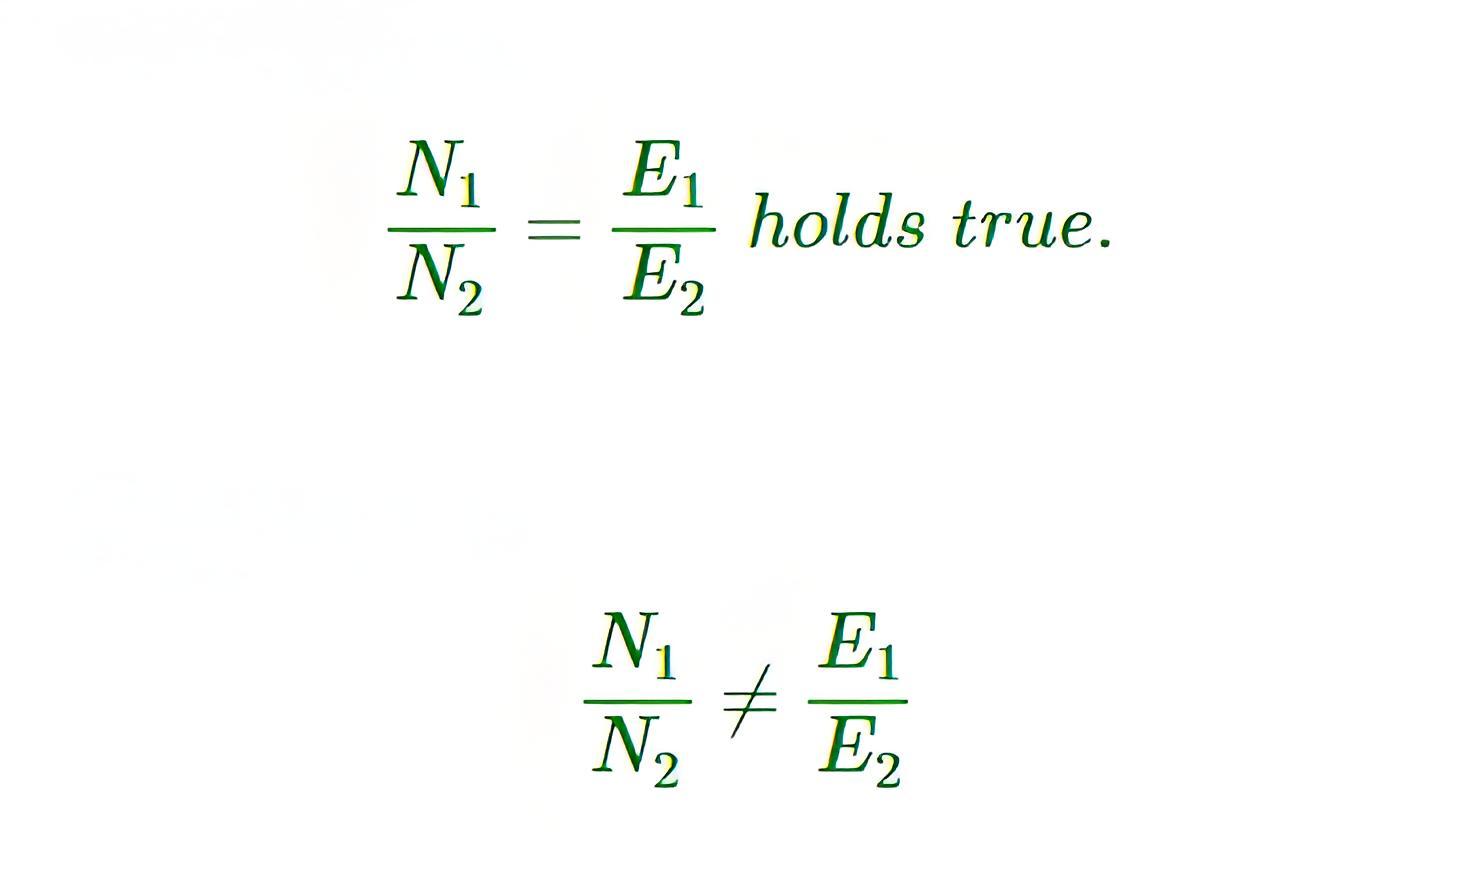
Thus for an off nominal transformer we define the transformation ratio (a) as follows

Now we would like to represent an off nominal transformer in a line by an equivalent model.

Fig 2: Line Containing an Off Nominal Transformer
We want to convert the above into an equivalent π model between bus p and q.
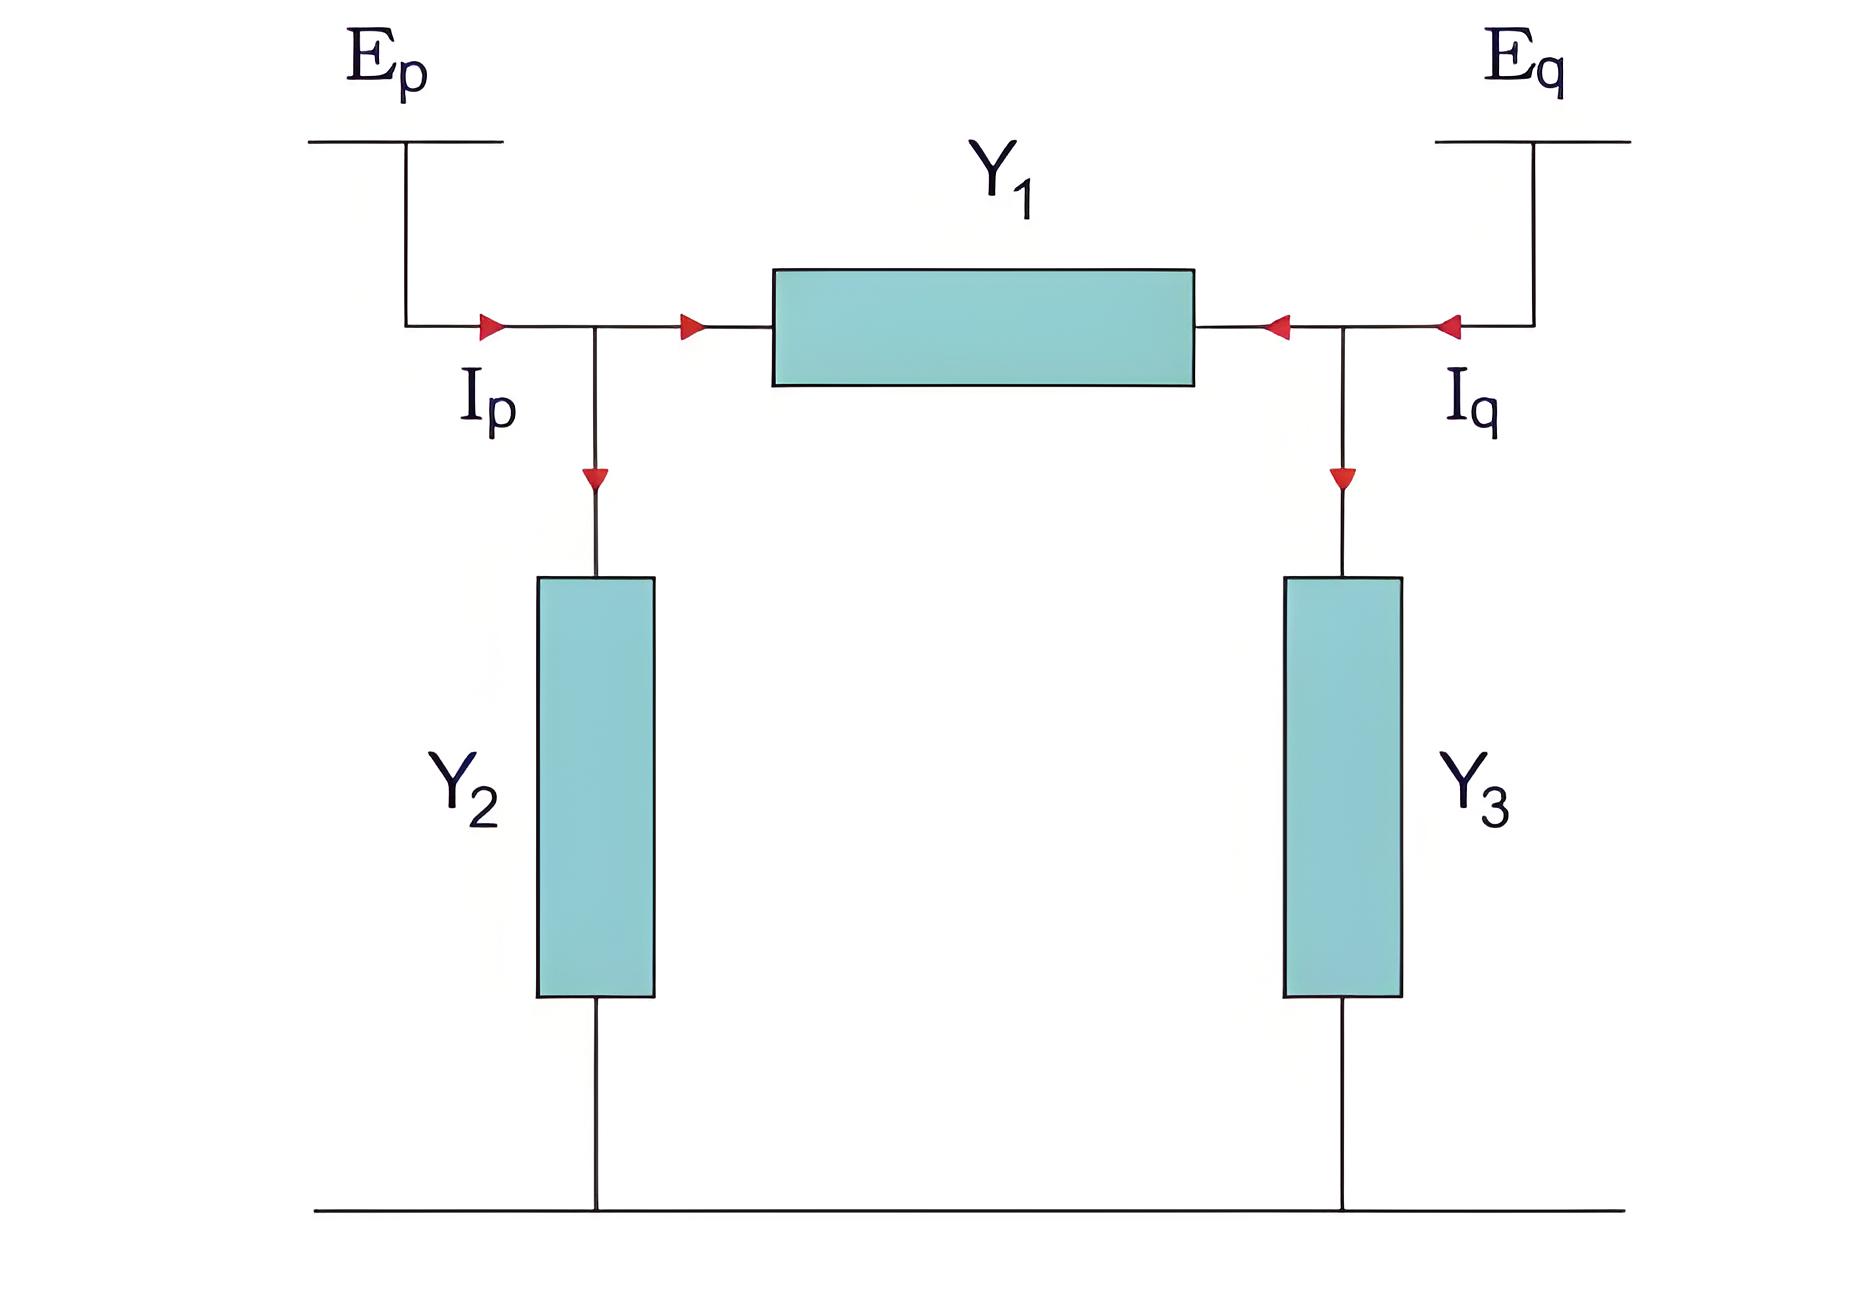
Fig 3: Equivalent π Model of Line
Our aim is to find these values of admittances Y1, Y2 and Y3 so that fig2 can be represented by fig 3.From Fig 2 we have,
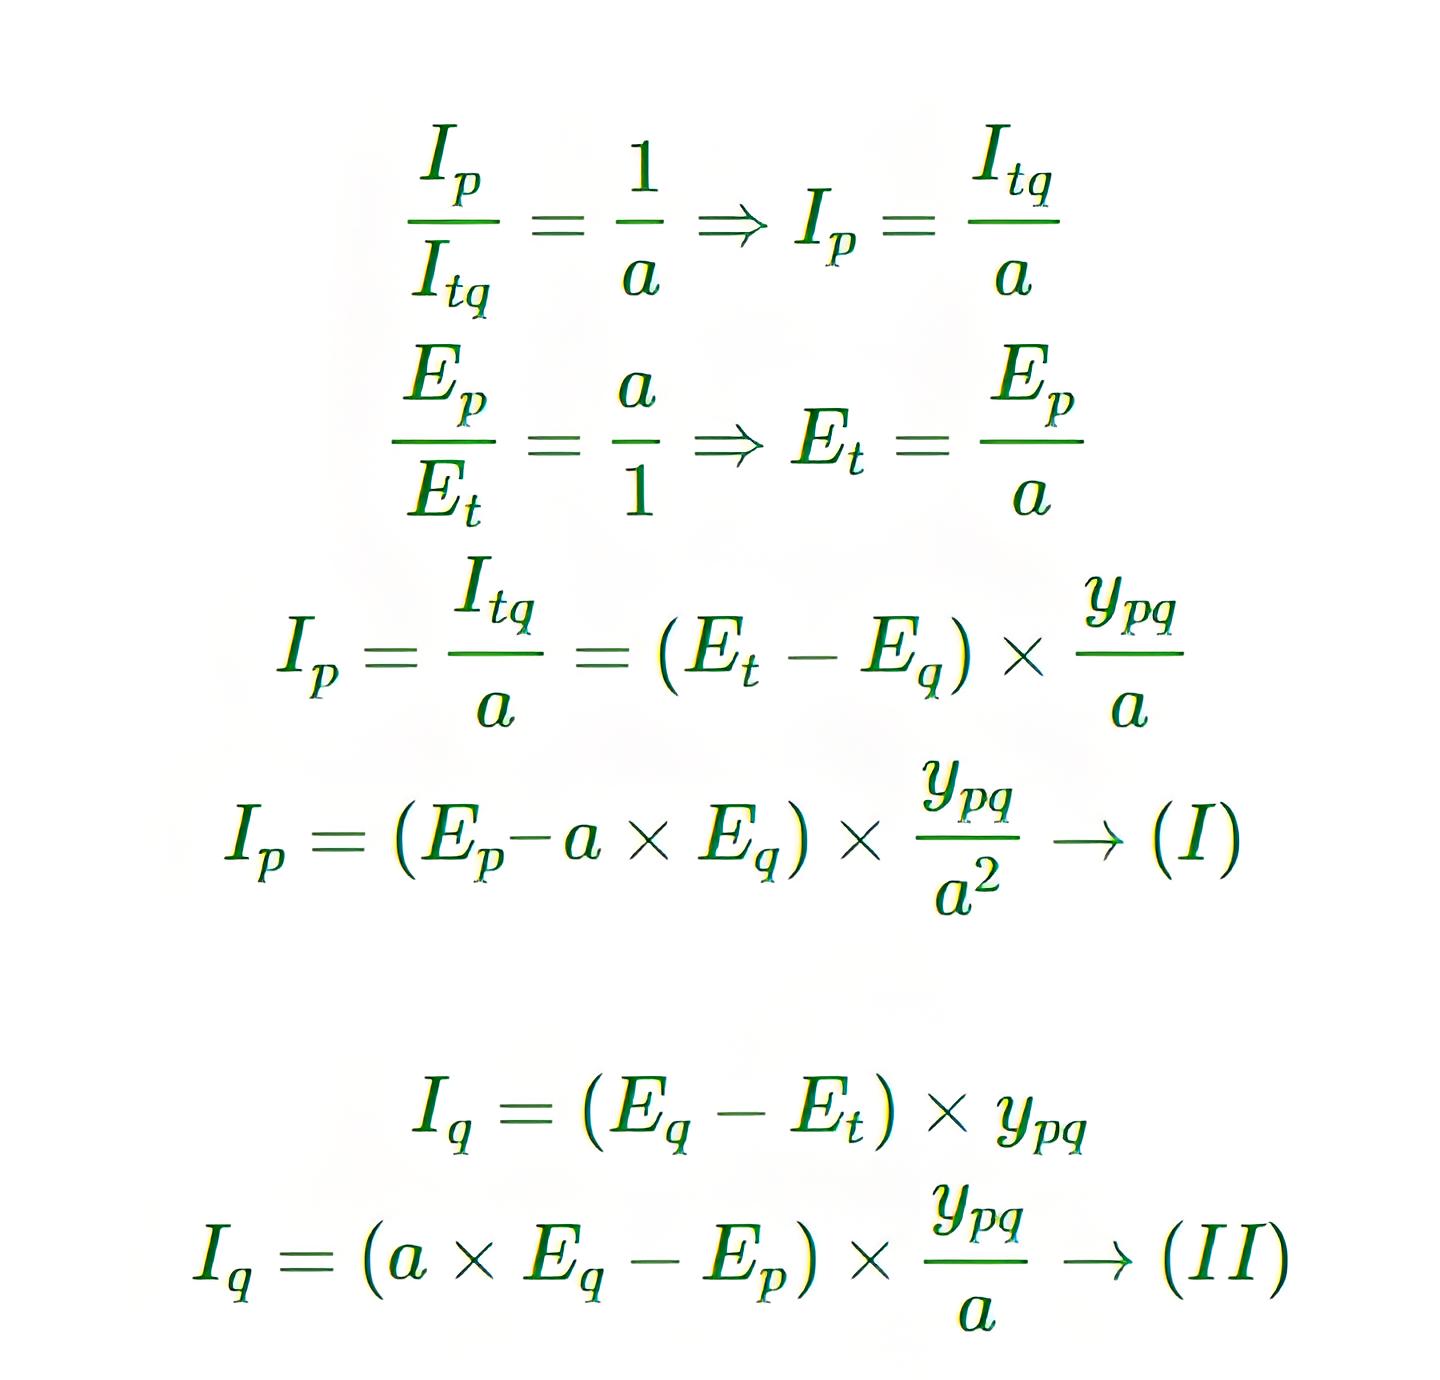
Now consider Fig 3, from fig3 we have,
From eqn I and III on comparing the coefficients of Ep and Eq we get,

Similarly from equation II and IV we have
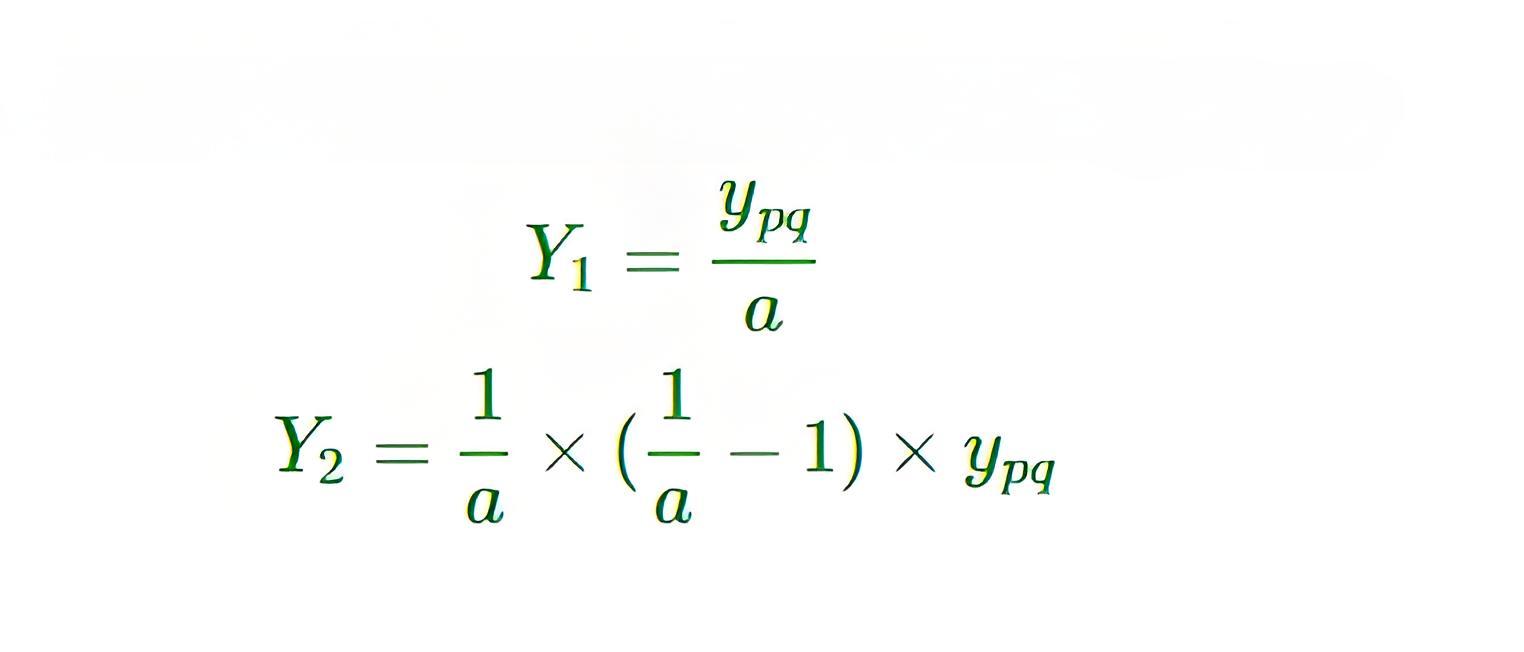
Some useful observations
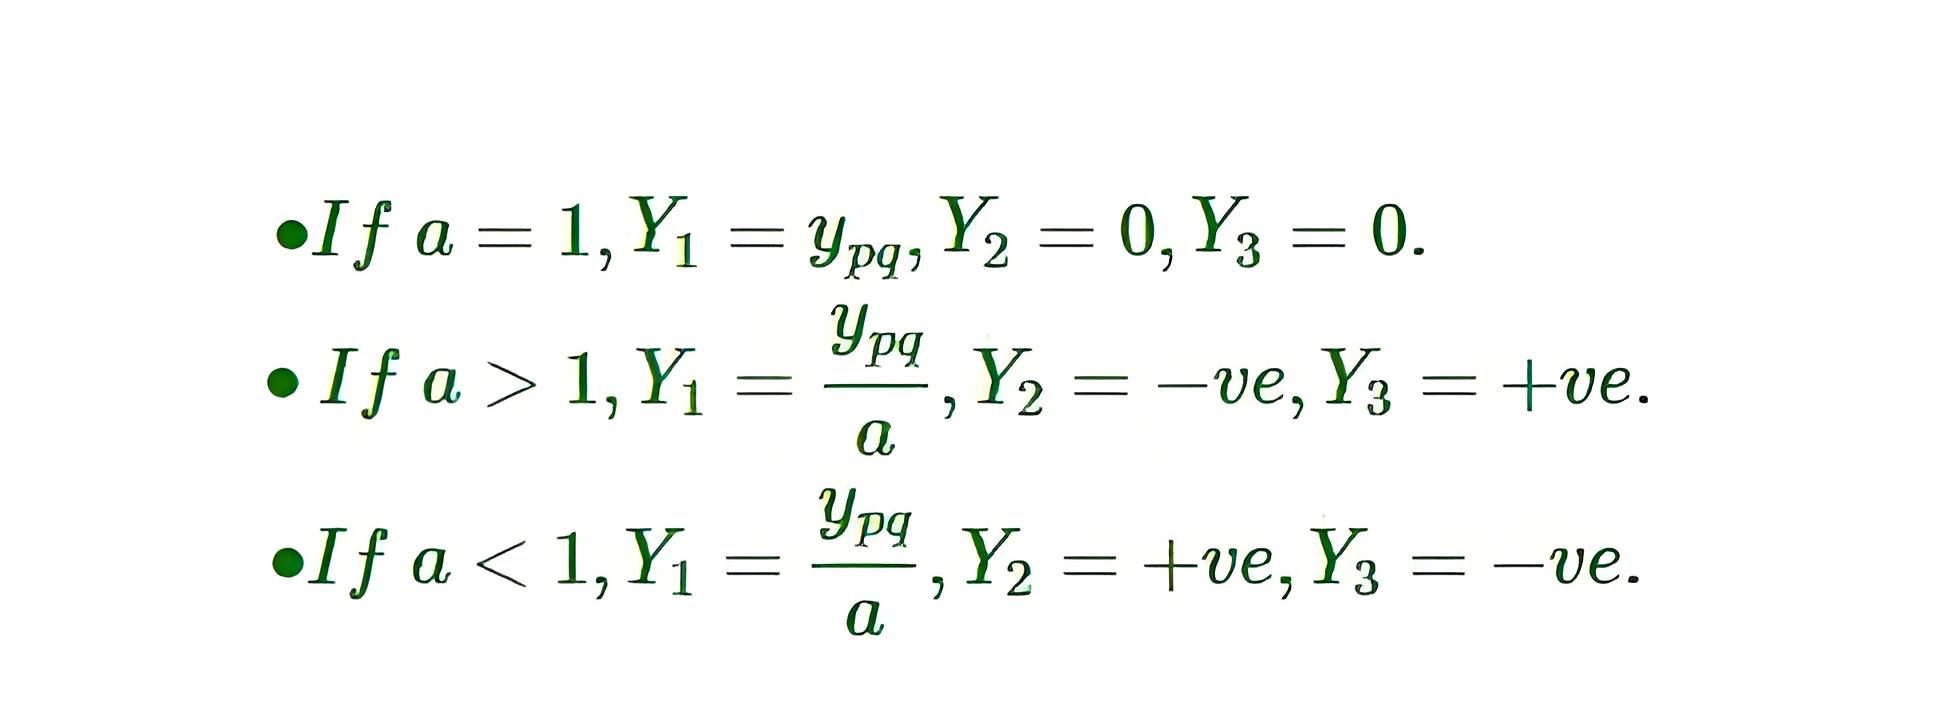
From above analysis we see that Y2, Y3 values can either be positive or negative depending on the value of transformation ratio.

Good question!
Y = – ve implies absorption of reactive power i.e it is behaving as an inductor.
Y = + ve implies generation of reactive power i.e it is behaving as a capacitor.
Modeling of a Network
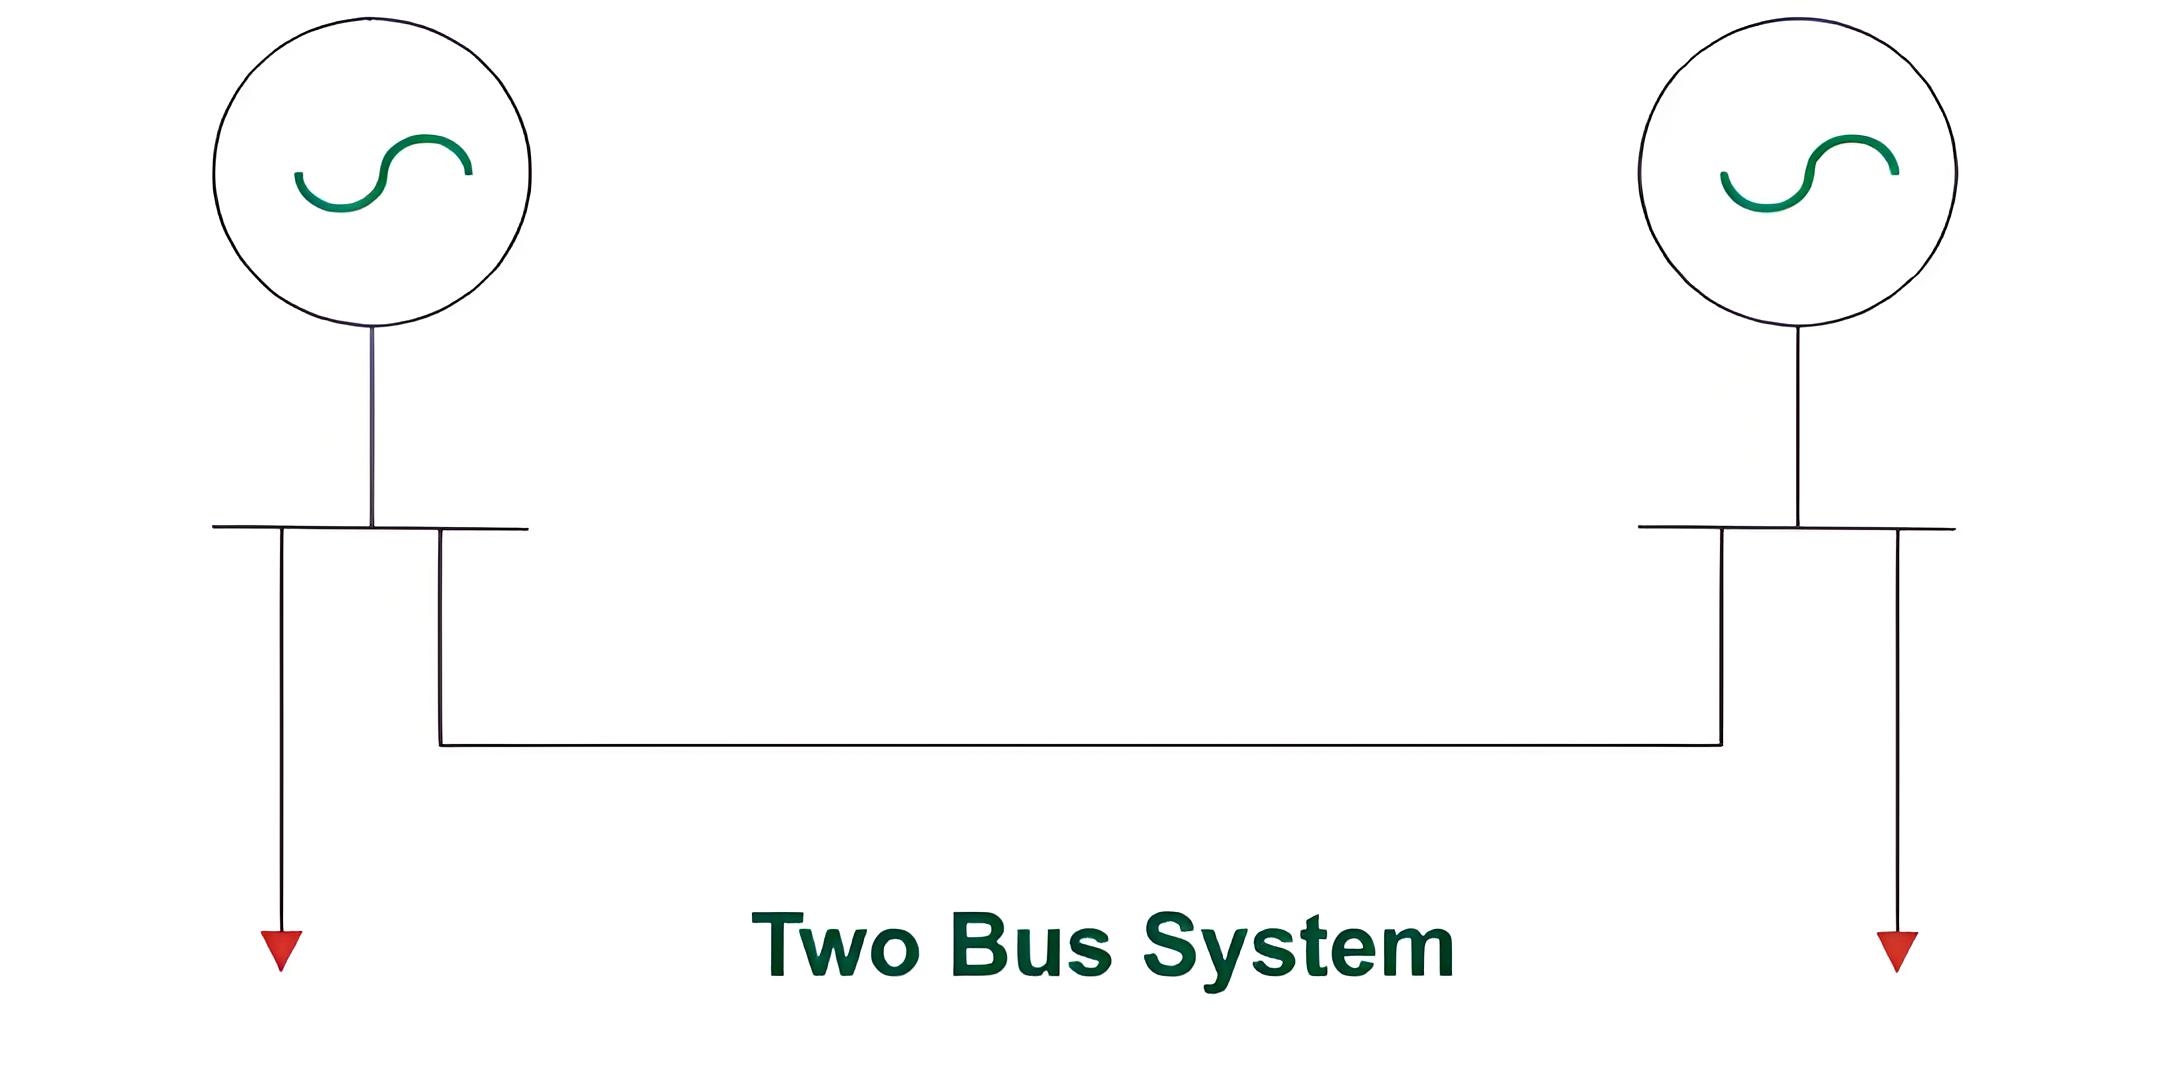
Consider the two bus system as shown in figure above.
We have already seen that
Power generated at bus i is
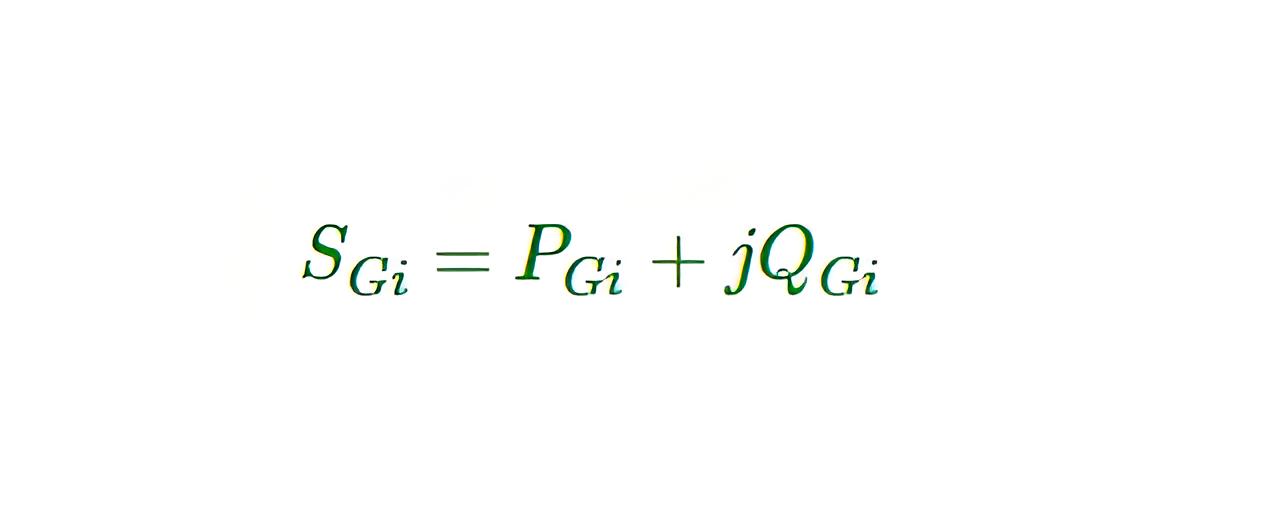
Power demand at bus i is
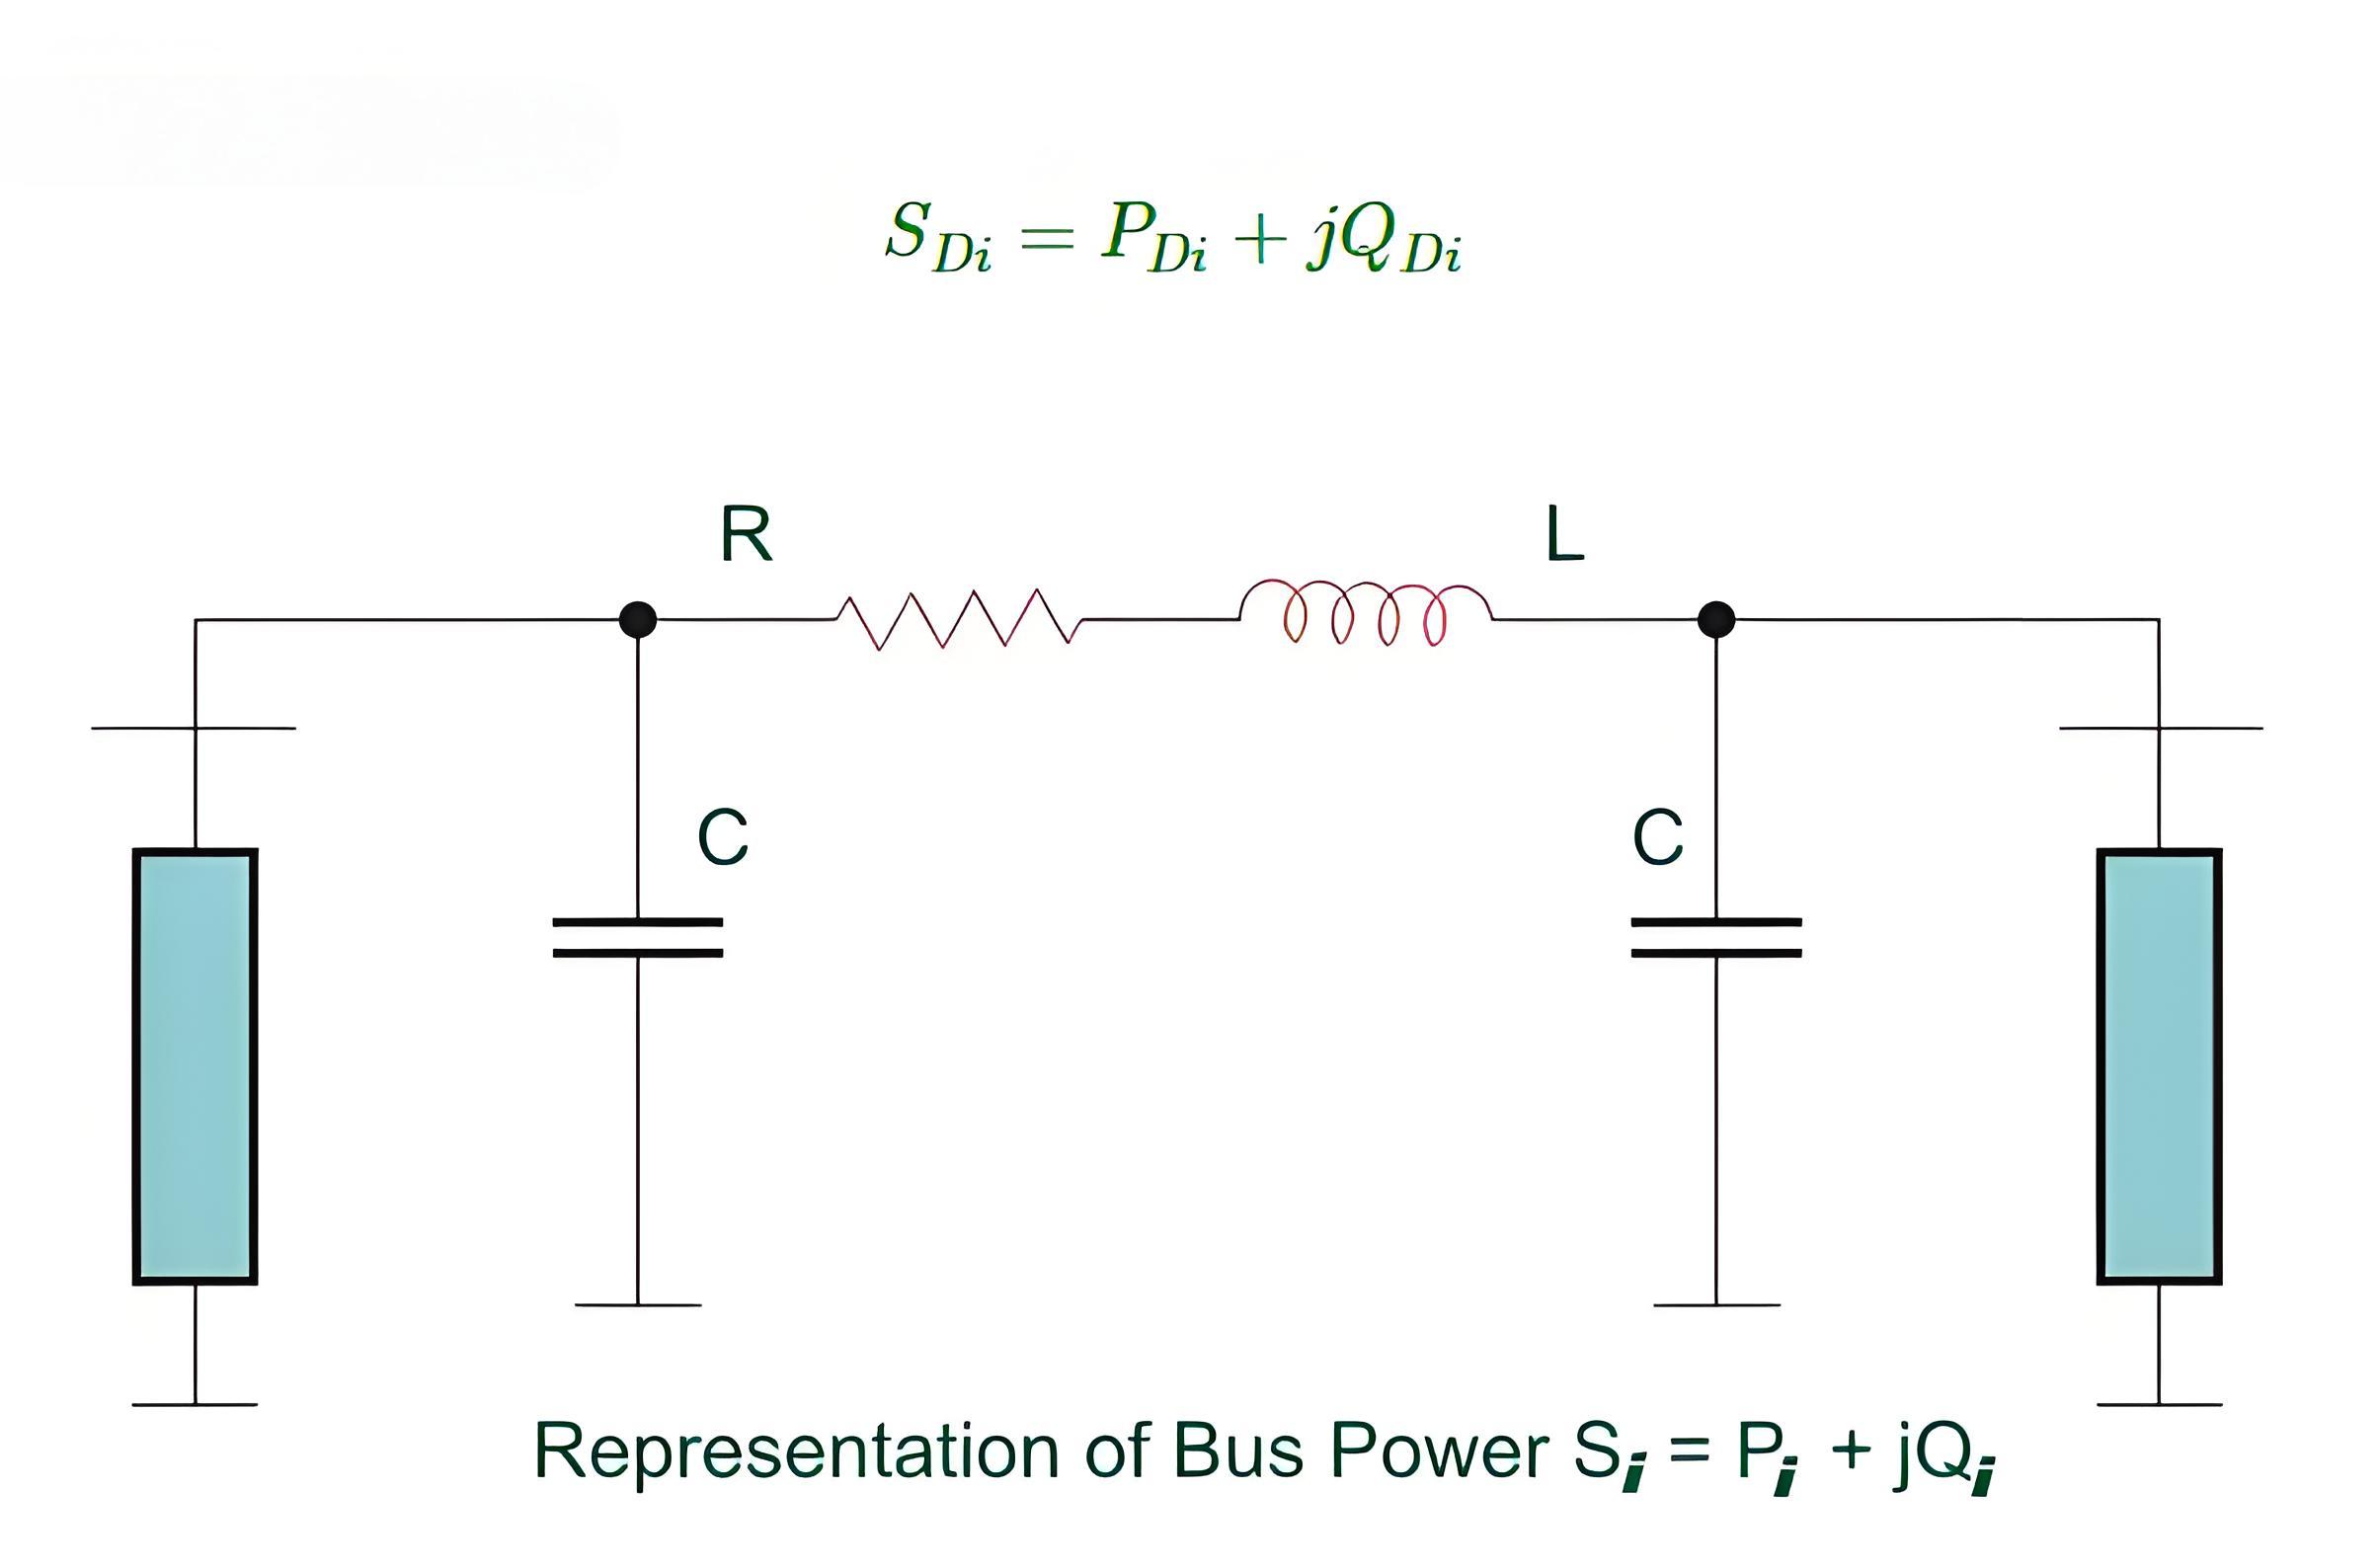
Therefore we define the net power injected at bus i as follows

The Electricity Encyclopedia is dedicated to accelerating the dissemination and application of electricity knowledge and adding impetus to the development and innovation of the electricity industry.
